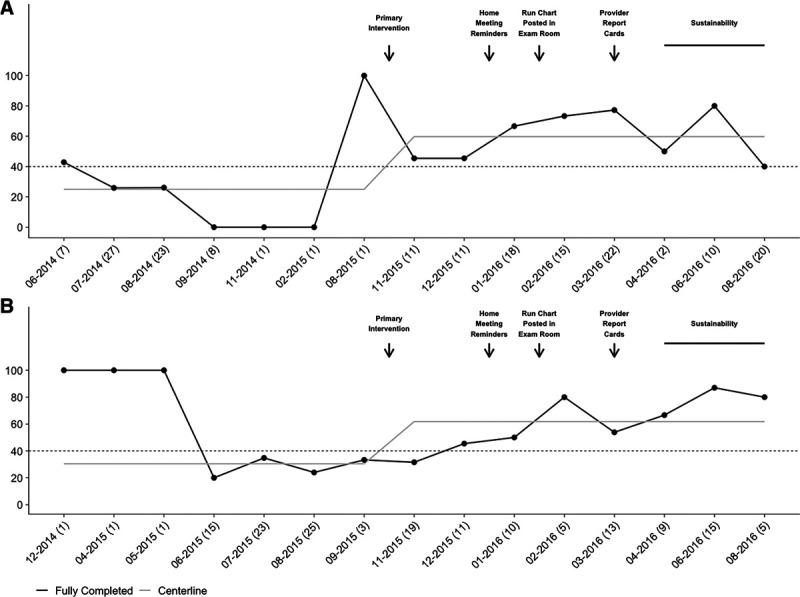
Fig. 3.

Run chart of completed SDOH screening documentation. Run chart: Newborn (A) and 1-year visits (B) at which documentation of all nine screening questions increased following the implementation of paper screening forms and subsequent PDSA cycles. The horizontal line indicates the goal rate of 40%.
