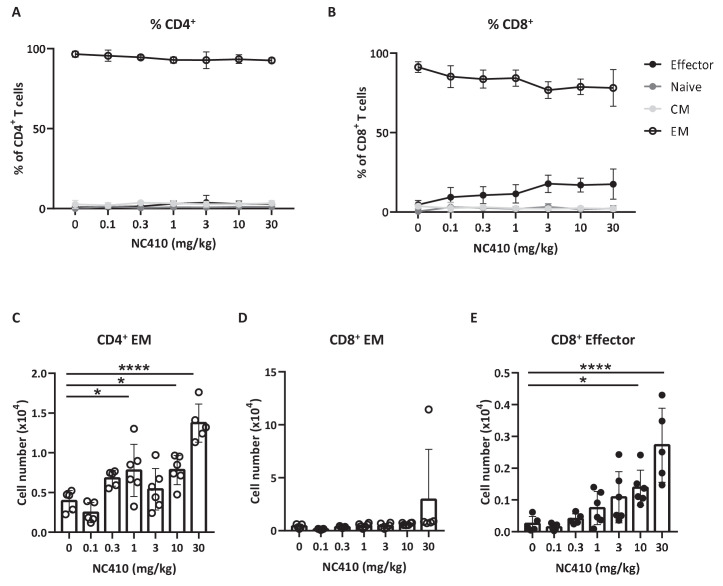
Figure 3. NC410 therapy promotes human T cell expansion in a xenogeneic-graft versus-host disease model.
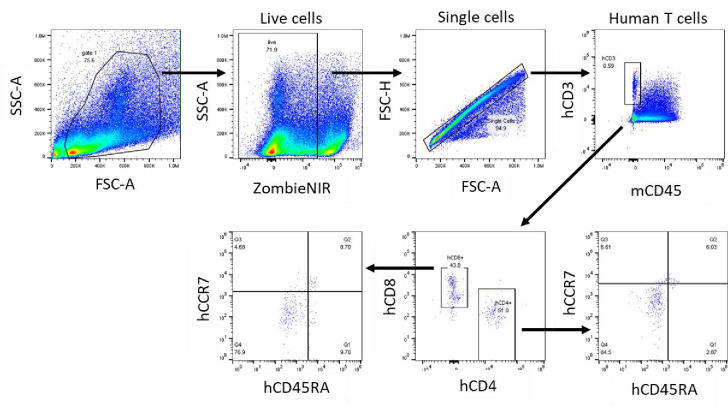
In a non-tumor model, 1 × 10⁷ total human peripheral blood mononuclear cells were adoptively transferred intravenously to NSG mice (N = 6/group) on day 0. Mice were treated with indicated doses of NC410 by intravenous injection on days 0 and 2. On day 6, mice were euthanized and spleens were analyzed for naïve (CD45RA+CCR7+), central memory (CM, CD45RA-CCR7+), effector memory (EM, CD45RA-CCR7-) and effector (CD45RA+CCR7-) CD4+ (A) and CD8+ (B) T cell populations. The graph shows the percentage of T cell subpopulations as a percentage of total human T cells. (C–E) Cell counts of (C) CD4+EM, (D) CD8+EM and (E) CD8+ effector T cells in the spleen. The graphs show the means ± SD (error bars). Asterisks indicate statistical significance: *p<0.05, **p<0.01, ***p<0.001, ****p<0.0001, one-way ANOVA followed by Tukey’s multiple comparisons.

