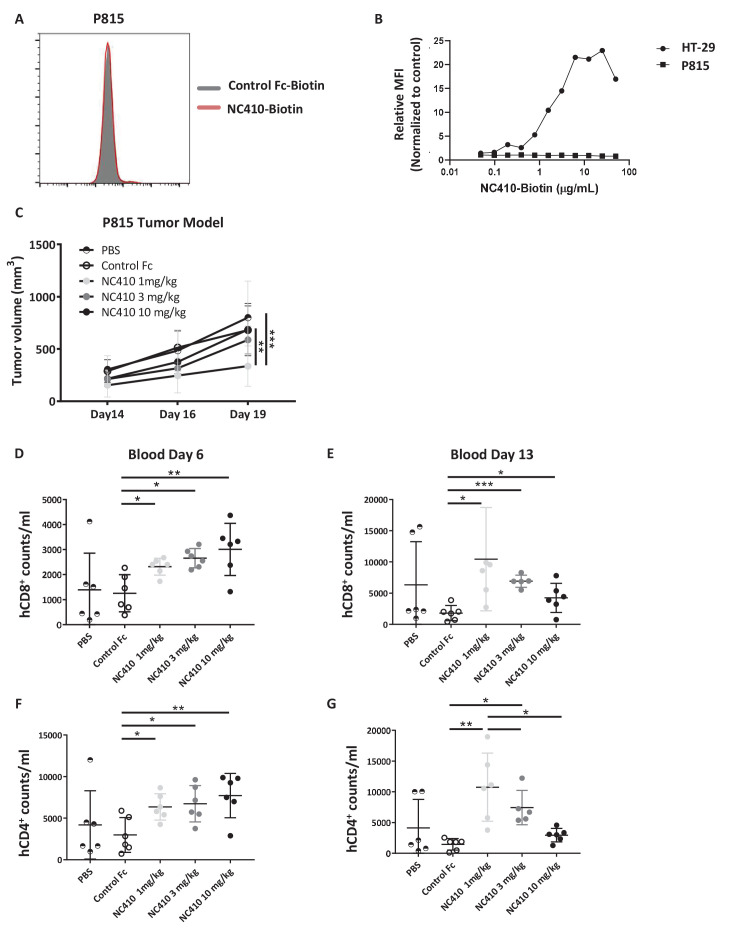
Figure 4. NC410 therapy controls in vivo tumor growth of tumor cells that do not express collagen.
(A) Histogram plot showing mouse P815 tumor cells stained with NC410-biotin or control Fc-biotin. (B) Mouse P815 cells and human HT-29 cells were stained with titrated concentrations of NC410-biotin. (C) 1.5 × 10⁷ total human peripheral blood mononuclear cells were adoptively transferred by intravenous injection to NSG mouse on day 0, and 2 × 10⁵ P815 tumor cells in Matrigel were injected subcutaneously on day 1. Mice were treated on days 1 and 3 with indicated dose of NC410 or control IgG1 (10 mg/kg) by intraperitoneal injection (N = 6/group). P815 tumor was measured every 2–3 days with a caliper, and tumor volume was calculated. Asterisks indicate statistical significance: **p<0.01, ***p<0.001, two-way ANOVA with Sidak multiple comparisons correction. (D–G) CD8+ (D, E) and CD4+ (F, G) T cell analysis of cell numbers in blood on days 6 (D, F) and 13 (E, G). The graphs show the means ± SD (error bars). Asterisks indicate statistical significance: *p<0.05 **p<0.01 ***p<0.001, two-way ANOVA with Sidak multiple comparisons correction.

