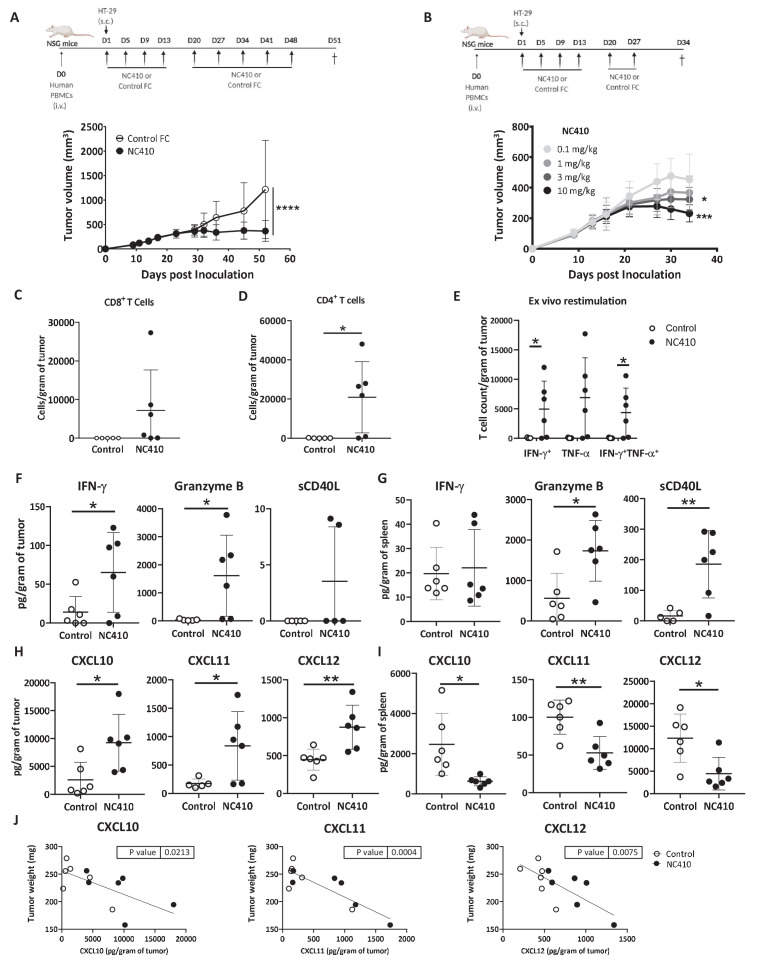
Figure 5. NC410 promotes T cell anti-tumor immunity in an HT-29 humanized tumor model.
(A) Humanized tumor model of HT-29 tumor cells injected subcutaneously in the presence of human peripheral blood mononuclear cells (PBMCs). 2 × 10⁷ total human PBMCs were adoptively transferred intravenously to NSG mice (N = 6/group) on day 0. 1 × 10⁶ HT-29 tumor cells were injected subcutaneously with Matrigel on day 1. Mice were treated with 10 mg/kg NC410 or control by intraperitoneal injection, Q4D × 4 doses followed by Q7D until endpoint. Tumor growth was monitored 1–3 times a week. Asterisks indicate statistical significance: ****p<0.0001, two-way ANOVA with Sidak multiple comparisons correction. (B) Dose-dependent effect of NC410 (N = 6/group). Experimental conditions are the same as (A), with different doses of NC410. Asterisks indicate statistical significance: *p<0.05, ***p<0.001, two-way ANOVA with Tukey's multiple comparisons correction. (C–G) On day 27 after treatment with 10 mg/mL NC410, tumor and spleen tissues were isolated for tumor-infiltrating T cells (TILs) and cytokine analysis. (C) CD4+ and (D) CD8+ TIL cell numbers in the tumor. The cell number was counted by flow cytometry and normalized to weight (gram) of tumor tissue. Asterisks indicate statistical significance: *p<0.05, two-tailed t-test. (E) Cytokine production by TILs following ex vivo restimulation with phorbol 12-myristate 13-acetate (PMA) and ionomycin for 5 hr. Cells were intracellularly stained for IFN-γ and TNF-α, and the indicated cell populations were counted by flow cytometry and normalized to weight (gram) of tumor tissue. Asterisks indicate statistical significance: *p<0.05, two-tailed t-test. (F–I) Tissue lysate protein was extracted from tumor and spleen tissues. Analysis of tumor (F, H) and spleen (G, I) for cytokines (F, G) and chemokines (H, I) for analysis of local and systemic effects, respectively. Cytokines and chemokines were analyzed by Luminex and presented as the relative levels normalized to weight (gram) of tissue. (J) CXCL10, CXCL11 and CXCL12 correlation with tumor weight. The graphs show the means ± SD (error bars). Asterisks indicate statistical significance: *p<0.05, **p<0.01, two-tailed t-test.

