. 2021 May 14;10:e59437. doi: 10.7554/eLife.59437

Figure 2. Wealth and inequality posterior parameter values for models with adults (>15 years).

Points are posterior medians and lines are 75% (thick) and 95% (thin) highest posterior density intervals. Numbers in each panel represent the proportion of the posterior distribution that is greater than zero (P>0). All models control for age, sex, distance to market town, and community size. Rough categories of dependent variables (psychosocial, continuous health outcomes, and binary health outcomes) are distinguished by rows and colors. For the first two rows, the outcomes are expressed as Z-scores, the bottom row as log odds. See Figure 2—figure supplement 1, Figure 2—figure supplement 2, and Figure 2—figure supplement 3 for predicted associations of household wealth, community wealth, and wealth inequality, respectively.

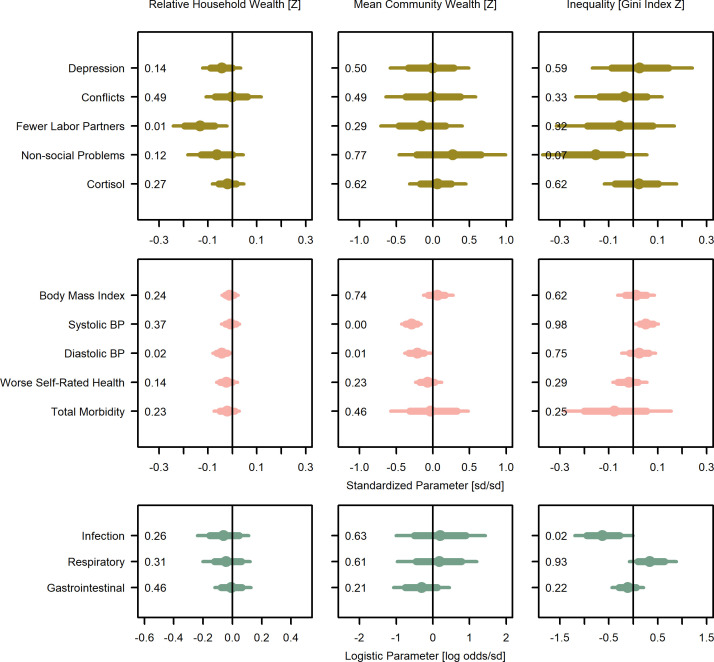
Figure 2.

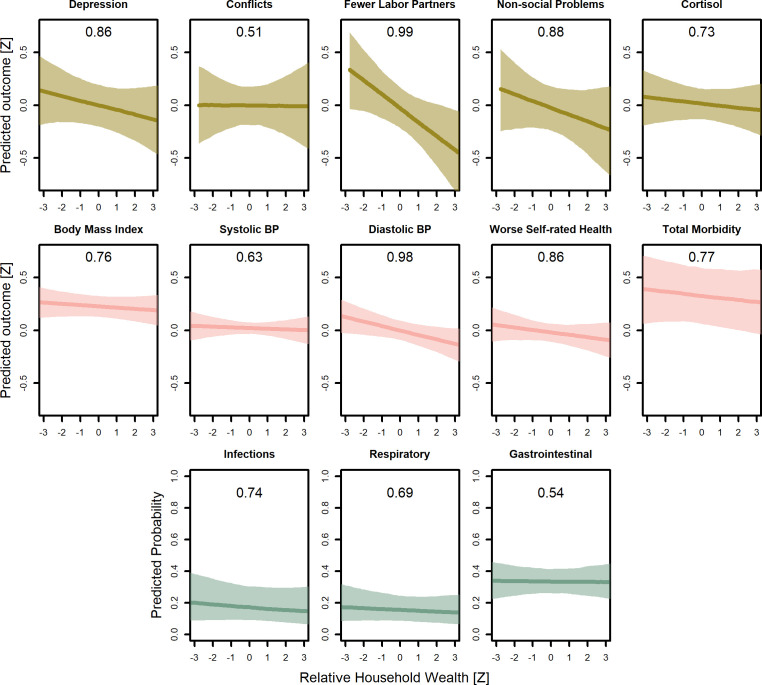
Figure 2—figure supplement 1. Predicted conditional effects of relative household wealth on all psychosocial and health outcomes for adults.

Figure 2—figure supplement 1.

Lines are posterior means and shaded areas are 95% credible intervals on mean values. Numbers in each panel represent the proportion of the posterior distribution that supports the predicted negative association between wealth and the outcome (P<0). All predictions control for age, sex, inequality, distance to market town, community size, and mean community wealth, holding all other variables at the mean, with sex = female. Rough categories of dependent variables (psychosocial, continuous health outcomes, and binary health outcomes) are distinguished by rows and colors. For the first two rows, the outcomes are measured as Z-scores, the bottom row as probabilities.
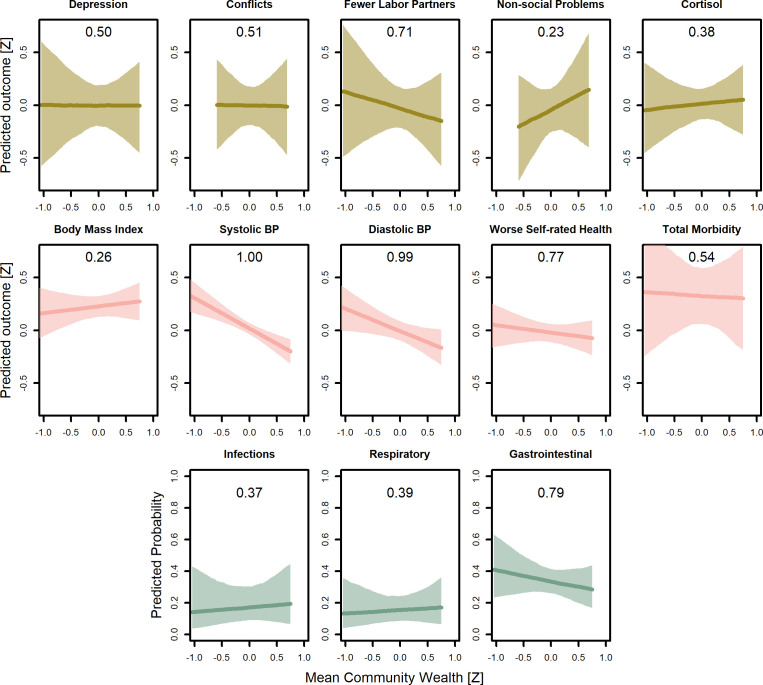
Figure 2—figure supplement 2. Predicted conditional effects of mean community wealth on all psychosocial and health outcomes for adults.

Figure 2—figure supplement 2.

Lines are posterior means and shaded areas are 95% credible intervals on mean values. Numbers in each panel represent the proportion of the posterior distribution that supports the predicted negative association between wealth and the outcome (P<0). All predictions control for age, sex, inequality, distance to market town, community size, and mean community wealth, holding all other variables at the mean, with sex = female. Rough categories of dependent variables (psychosocial, continuous health outcomes, and binary health outcomes) are distinguished by rows and colors. For the first two rows, the outcomes are measured as Z-scores, the bottom row as probabilities.
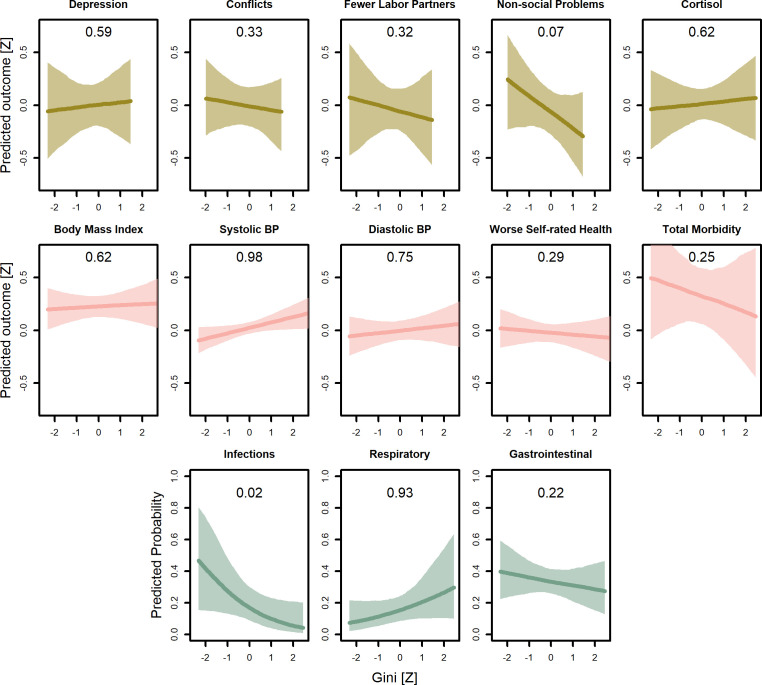
Figure 2—figure supplement 3. Predicted conditional effects of wealth inequality (Gini coefficients) on all psychosocial and health outcomes for adults.

Figure 2—figure supplement 3.

Lines are posterior means and shaded areas are 95% credible intervals on mean values. Numbers in each panel represent the proportion of the posterior distribution that supports the predicted negative association between wealth and the outcome (P<0). All predictions control for age, sex, inequality, distance to market town, community size, and mean community wealth, holding all other variables at the mean, with sex = female. Rough categories of dependent variables (psychosocial, continuous health outcomes, and binary health outcomes) are distinguished by rows and colors. For the first two rows, the outcomes are measured as Z-scores, the bottom row as probabilities.