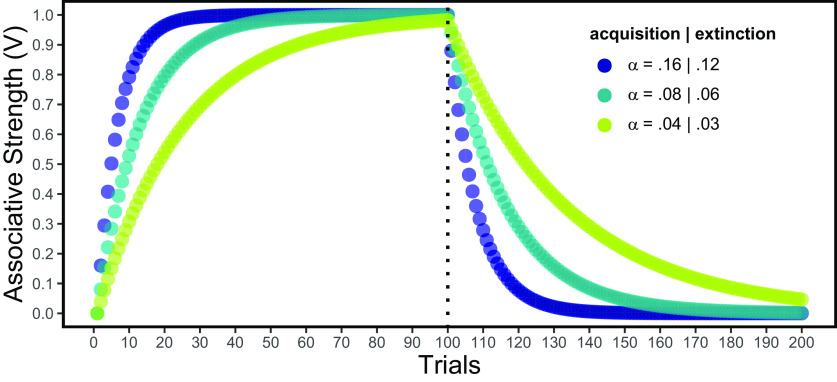
Figure 2.
Dynamics of associative strength according to the Rescorla–Wagner model in 100 consecutive trials of acquisition (λ = 1) followed by 100 extinction trials (λ = 0). Colors represent different learning rates (α), assuming that extinction rates are 3/4 of acquisition rates. Note that the decrease in responding (right panel) is a dynamic process that progresses with each trial, unlike the slow and continuous decay that would be expected if we simply allow time to pass.

