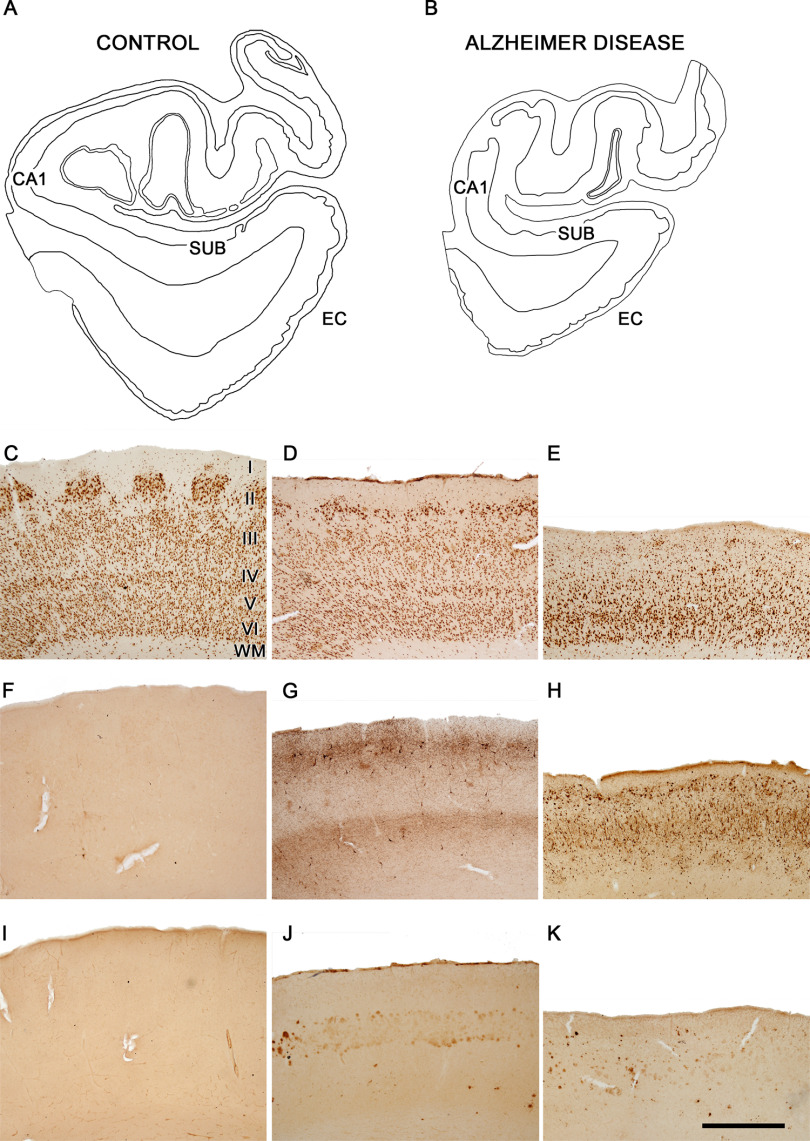
Figure 1.
EC of control and AD cases. Plots of the medial structures including the hippocampal formation and EC from control (A) and AD (B) cases to illustrate the atrophy that occurs in AD. Plots are based on Nissl-stained coronal sections from cases AB3 and IF1. Microphotographs showing the EC in a control case AB3 (C, F, I) and in AD cases IF1 (D, G, J) and VK16 (E, H, K). Layers are indicated to the right of panel C. Sections are immunostained with antibodies anti-NeuN (C–E), anti-PHF-Tau-AT8 (F–H), and anti-Aβ (I–K). Note the intense labeling of PHF-Tau-AT8-positive neurons (G, H) and Aβ-positive plaques (J, K) in AD cases, particularly in case VK16, and the lack of labeling in the control case. CA1, cornu ammonis field 1; SUB, subiculum; WM, white matter. Scale bar in K: 4 mm (A, B) and 1 mm (C−K).

