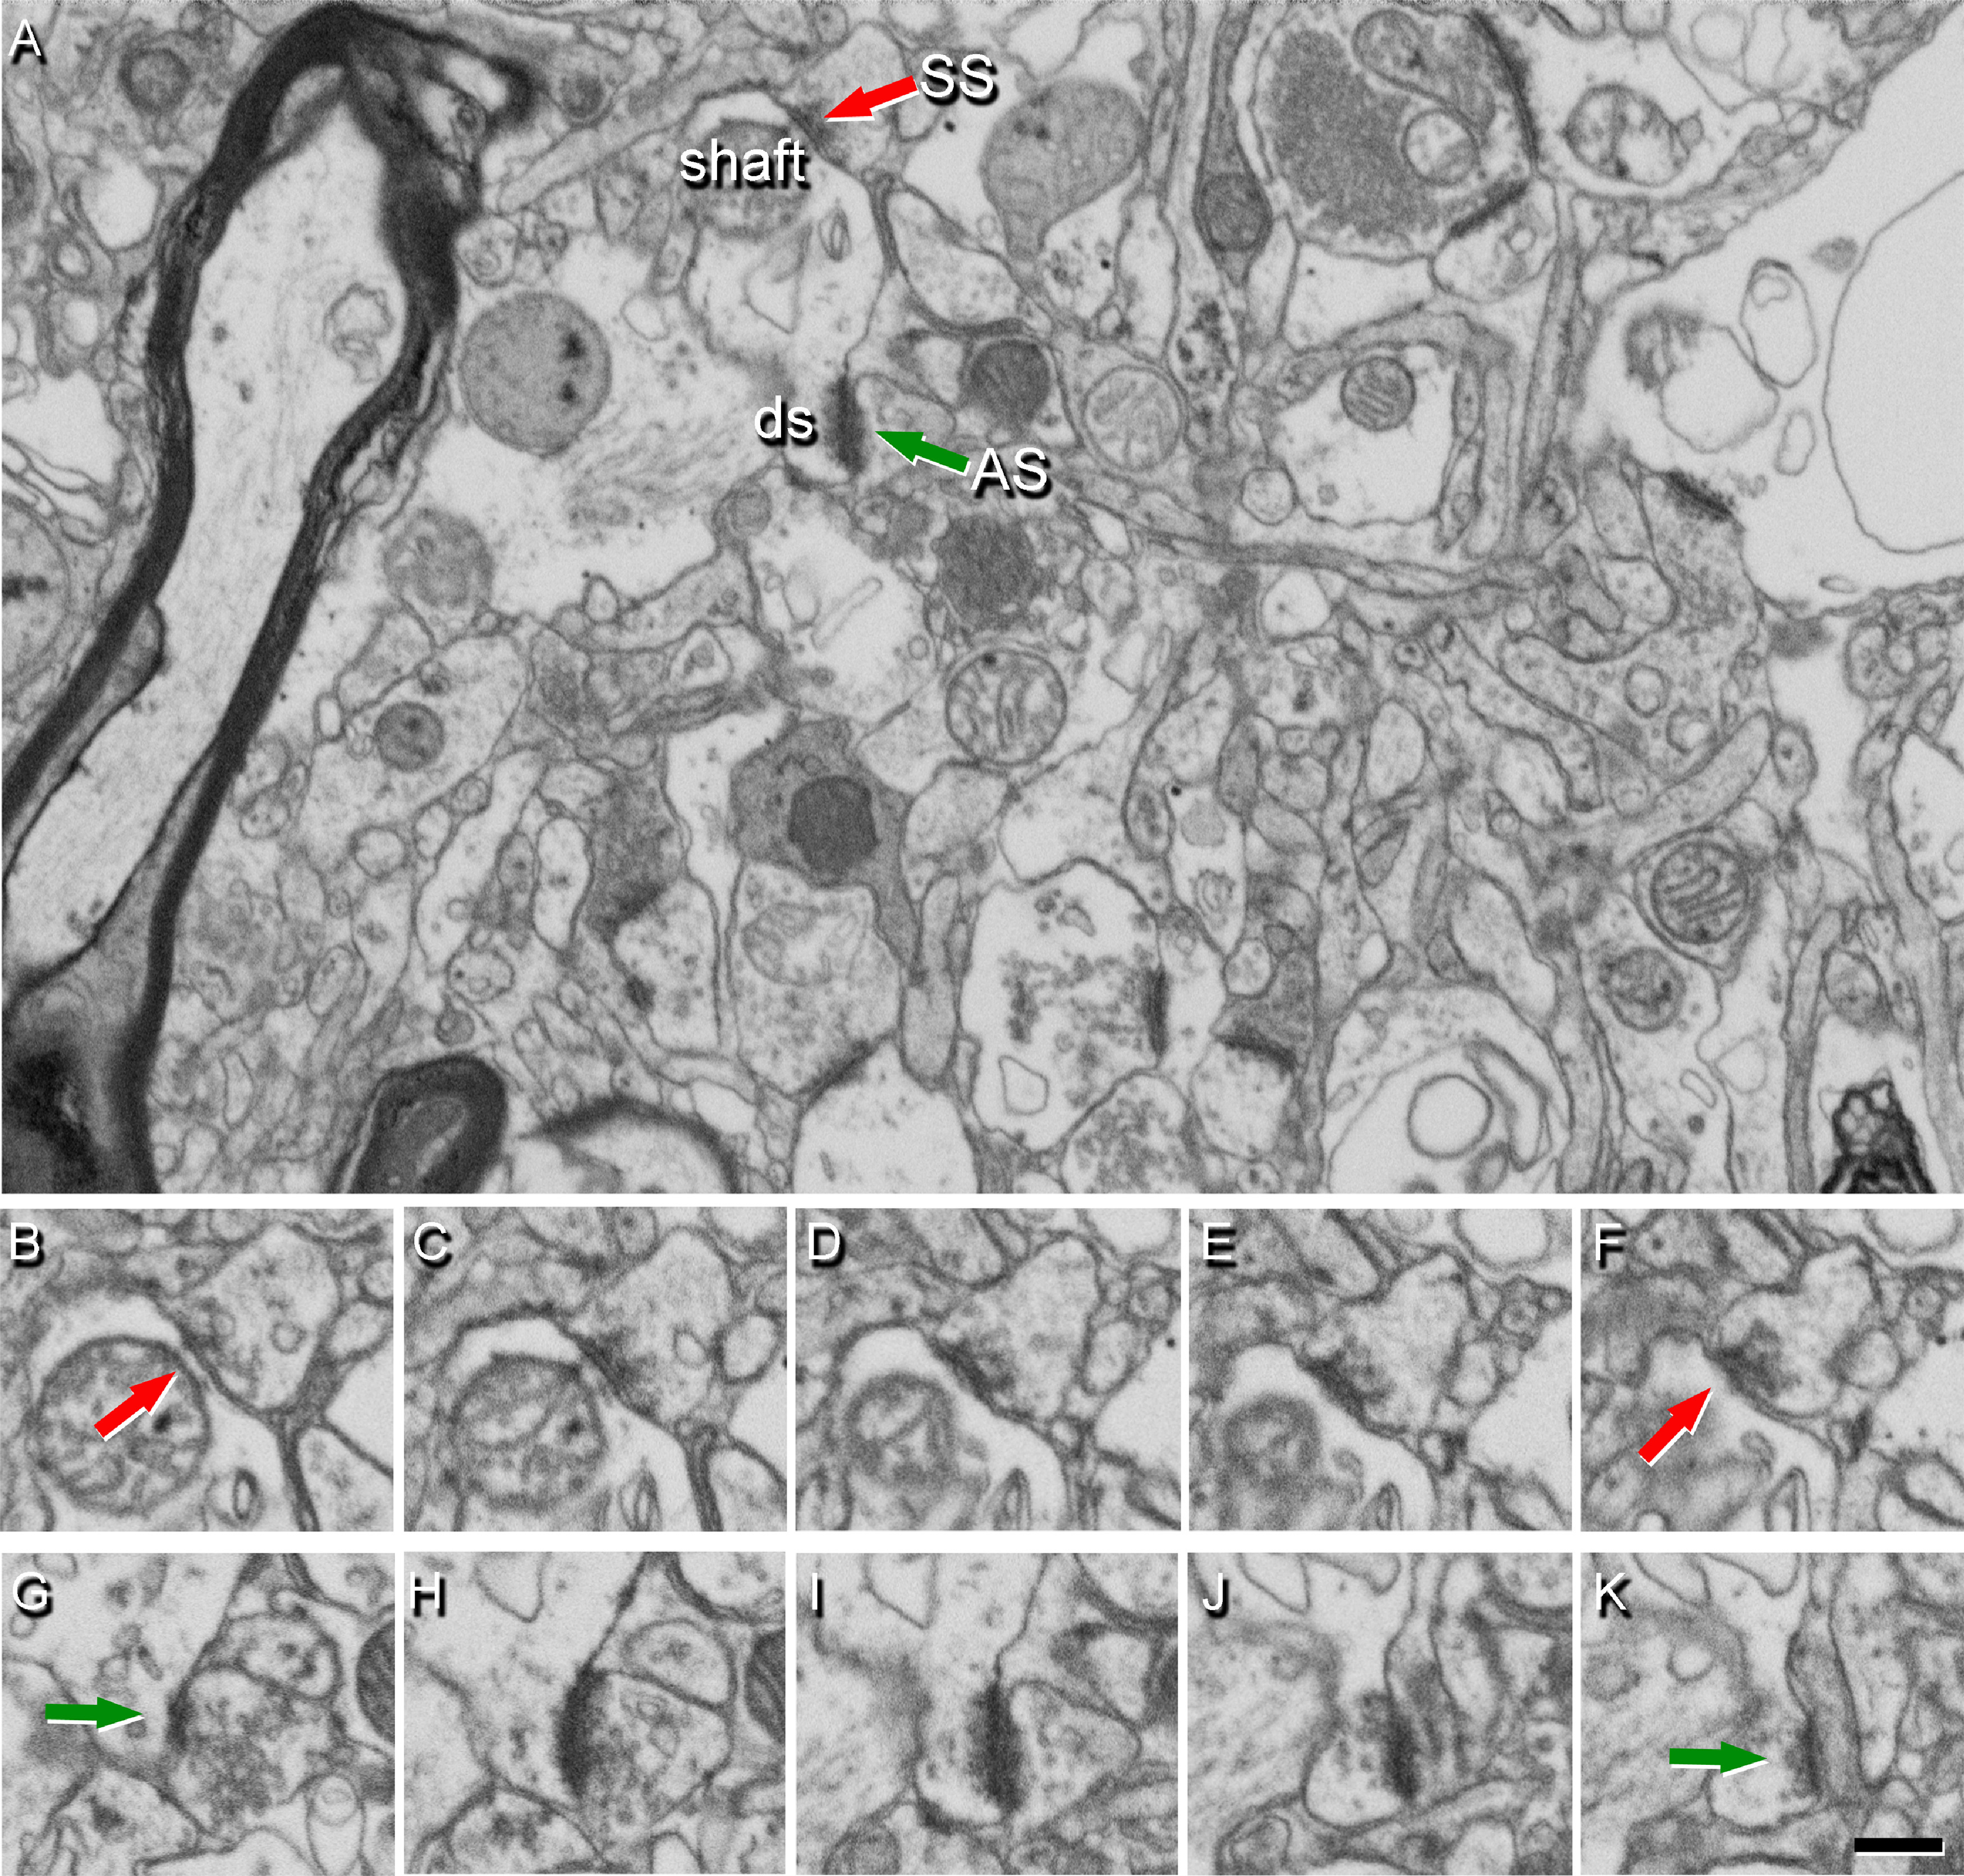
Figure 4.

Identification of synapses in serial EM images obtained by FIB/SEM. A, Image from Layer II showing the neuropil from an AD case, with two synapses indicated (arrows) as examples of SS (red) on a dendritic shaft, and AS (green) on a dendritic spine head (ds). Synapse classification was based on examination of the full sequence of serial images; the SS can be visualized in B−F, and the AS in G−K. Scale bar in K: 460 nm (A) and 360 nm (B−K).
