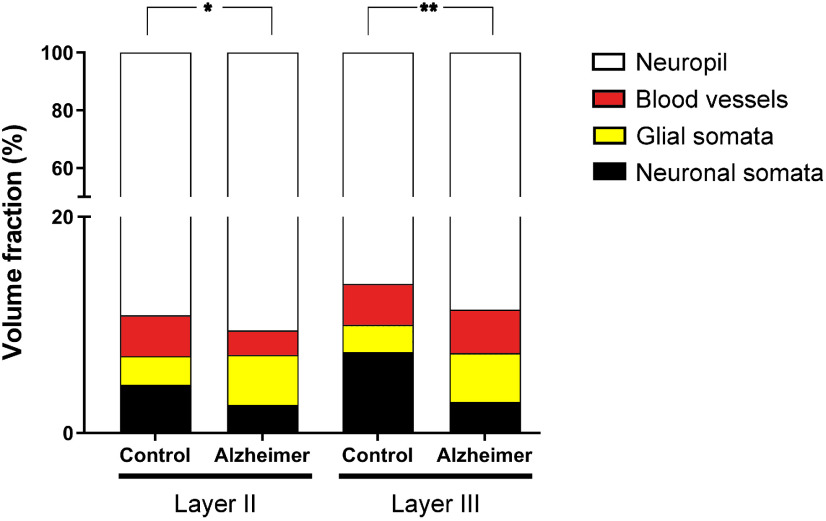
Figure 6.
Graph showing the Vv occupied by neuronal and glial somata, blood vessels, and neuropil in both Layers II and III of the EC from control subjects and AD cases. Asterisks show the differences between groups. In Layer II, a significantly higher Vv of glial somata was found in AD cases (t test, p = 0.03). In Layer III, a significantly lower Vv of neuronal somata was found in AD cases (t test, p = 0.007). Mean values and case values are detailed in Extended Data Table 1-2, Table 1-3.

