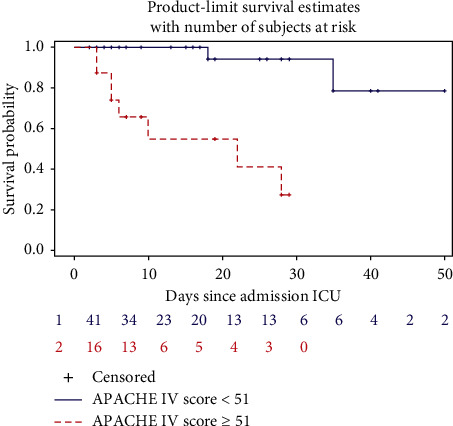
Figure 3.

Kaplan–Meier survival curve of critically ill COVID-19 patients stratified by the APACHE IV score. The number of patients at risk is shown in the graph.

Kaplan–Meier survival curve of critically ill COVID-19 patients stratified by the APACHE IV score. The number of patients at risk is shown in the graph.