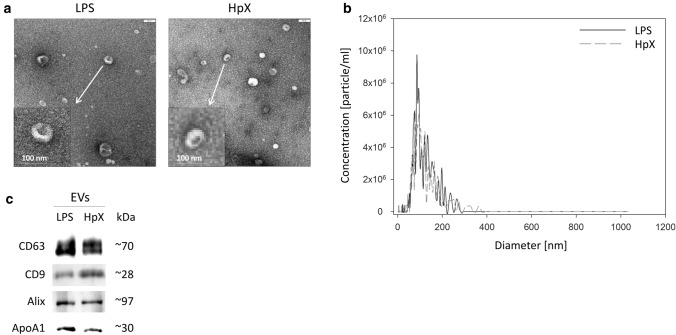
Fig. 3.
Characterization of rat serum-derived EVs. a Negative stain transmission electron microscopy revealed the size and shape of EVs concentrated from LPS- and HpX-treated rats. Scale bar 100 nm. b Nanoparticle tracking analysis determined the size distribution (x-axis) and particle concentration (y-axis) of the isolated yield. c Western blot analysis showed EV protein marker (CD63, CD9, Alix) and high-density lipoprotein marker (ApoA1) expression. Molecular weights (kDa) of each protein are indicated

