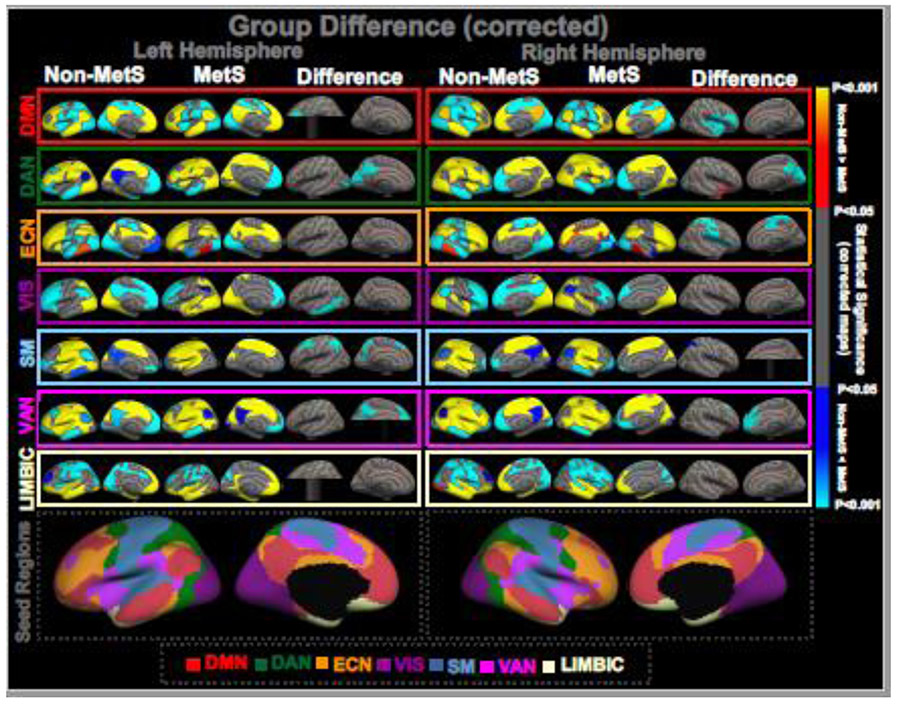
Figure 1: GROUP DIFFERENCE IN FUNCTIONAL CONNECTIVITY (FC).
One-sample group mean (OSGM) results from FC analyses for non-metabolic syndrome (Non-MetS, N=51; risk factors ranging from zero to two) and patients with metabolic syndrome (MetS, N=27; three or more risk factors), and their group differences in brain network FC after corrected for multiple comparisons (p<0.05). Uncorrected maps of the group differences in network FC are provided in supplemental Figure S2. Composite maps of group difference are presented in supplemental Figure S3 summarizing the group difference across all seven functional networks, and are color-coded based on the underlying seed regions. Results are corrected for age and sex. DMN: default-mode network; DAN: dorsal attention network; ECN: executive control network; VIS: visual network; SM: sensorimotor network; VAN: ventral attention network; LIMBIC: limbic network. The color bar indicating “red to yellow: non-MetS > MetS”; and “blue to cyan: MetS > non-MetS”.

