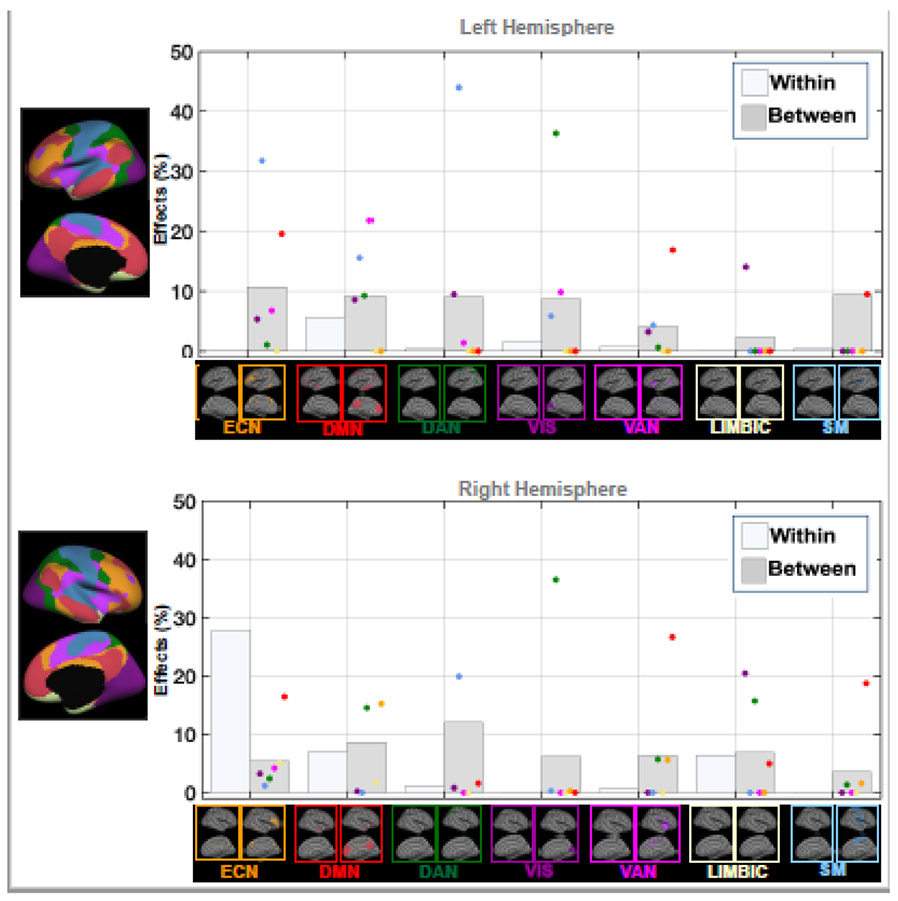
Figure 2: WITHIN- AND BETWEEN-NETWORK EFFECTS OF METS.
Bar plots showing MetS-related significant within- and between-network associations (%) in functional connectivity (FC) across brain networks. Each dot is colored based on the associated seed region for a specific network (e.g., red dot=default mode network), and represents the association between MetS and the disrupted FC between a particular seed region and that network. DMN: default-mode network; DAN: dorsal attention network; ECN: executive control network; VIS: visual network; SM: sensorimotor network; VAN: ventral attention network; LIMBIC: limbic network. Supplementary Figure S1 provides the details on estimation the within- and between-network association measures.

