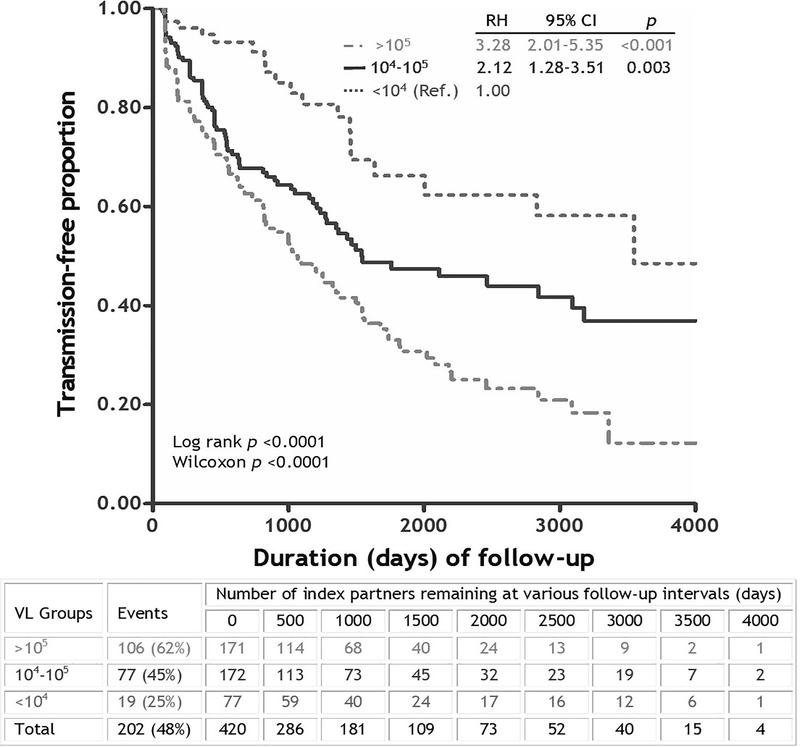
Figure 2. Kaplan-Meier curves showing the impact of HIV-1 viral load (VL) in donor/index partners on heterosexual HIV-1 transmission among 420 HIV-1 discordant Zambian couples with longitudinal follow-up.
The three VL categories followed earlier strategies [83], and subjects with low VL (<10−4 RNA copies/ml of plasma) were treated as the reference (ref.) group. The estimates of relative hazards (RH) and 95% confidence interval (CI) were based on a Cox proportional hazards model. Graph is redrawn from data published in 2008 [17]. Couples that remained eligible for further assessment at various follow-up intervals are indicated below the curves.

