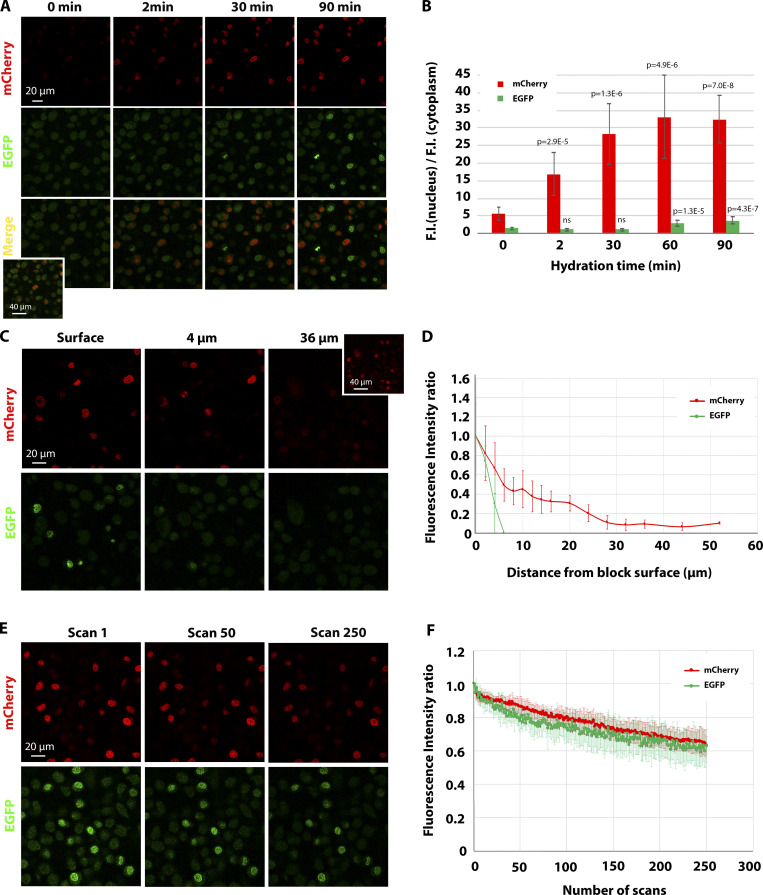
Figure 2.
Characterization of the behavior of mEGFP and mCherry fluorescence in resin block.(A) Confocal imaging of H2B-mCherry and H2B-mEGFP in the resin block upon different time of incubation of the block in water. The same confocal volume was acquired for each condition with the same settings. Note that at 0 min, mCherry fluorescence is low but detectable, whereas mEGFP cannot be detected above the background (see inset in the merge, where the intensity has been digitally amplified). (B) Histogram showing the ratio between the fluorescence intensity (F.I.) in the nucleus and the fluorescence intensity in the cytoplasm (background) for H2B-mCherry and H2B-mEGFP. The average value of 10–12 cells for mCherry and 5–15 for mEGFP ± SD is shown. t test was used to compare the ratio at each time point with the one at 0 min. P value is shown. (C and D) Fluorescence intensity measurements of H2B-mCherry and H2B-mEGFP in a confocal stack. A representative example is shown in C. Note that while mEGFP fluorescence drops to the background level past the water-exposed nuclei, the mCherry signal remains visible at higher depths (see inset, where the signal has been digitally amplified). The integrated fluorescence intensity of 9–12 nuclei per confocal slice was measured for each channel, and the average (±SD) is plotted in D in relation to the distance from the block surface. The data are normalized to the average fluorescence intensity of the nuclei at the surface. (E and F) Photobleaching behavior of H2B-mCherry and H2B-mEGFP in a resin block. An FOV containing both cell lines was consecutively scanned 250 times with the same settings used for standard imaging. Images are shown in E, and quantification of the integrated fluorescence intensity of 10 nuclei from three independent FOVs for each channel (±SD) is shown in F.

