
Figure 2.
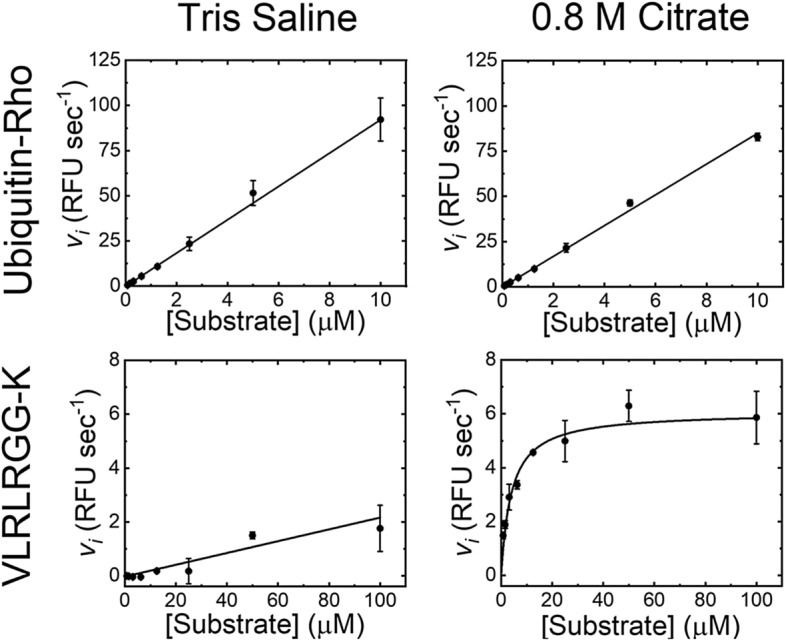
PLpro enzymology. The upper two panels show the initial rate of reaction for ubiquitin-rhodamine cleavage by PLpro in either tris-saline buffer or 0.8 M citrate. The lower two panels show the initial rate of substrate cleavage of a 7-mer peptide corresponding to the C-terminal of ubiquitin in either tris-saline buffer or 0.8 M citrate. The data points show the average of 4-replicates with error bars showing the standard deviation, with either a straight line or Michaelis–Menten fit shown as a solid black line.