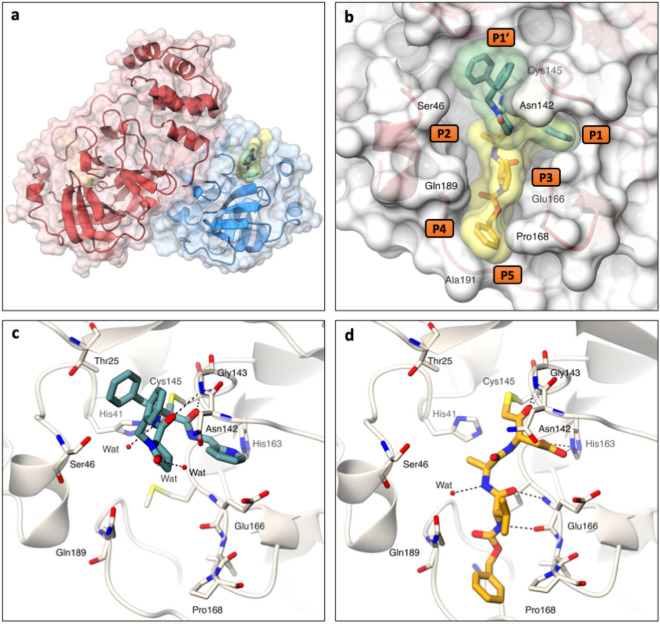
Figure 5.
Crystal structures of SARS-CoV-2 Mpro in complex with ReFRAME inhibitors. (a) Ribbon representation with transparent surface of the Mpro dimer coloured in red and blue to delineate each protomer. The structures of Mpro in complex with 1 and 5 (sticks with yellow and green transparent surface, respectively) reveal that both bind in the Mpro substrate binding pocket. (b) Surface representation showing the overall binding modes of compound 1 and 5 (green and yellow transparent surfaces, respectively). (c) and (d) Stick representations of compounds 1 and 5 showing interactions (hydrogen bonds as dashed lines) within the Mpro binding pocket. Structures are deposited in the pdb as 7AEH for 1 and 7AEG for 5. Figure generated with PyMOL, The PyMOL Molecular Graphics System, Version 2.0 Schrödinger, LLC (https://pymol.org/2/).

