Figure 2.
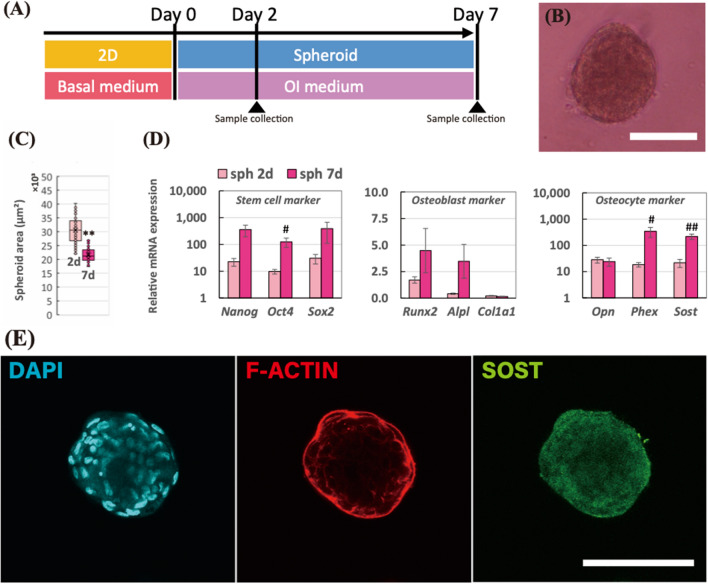
(A) Schematic of the experimental time line for spheroids incubated in the osteogenesis induction medium for 7 days. (B) Morphology of the spheroid after a 7-day incubation period. The scale bar represents 100 μm. (C) Mean values of projected area of the spheroids after 2 and 7 days. F-test was performed to examine the significance of area changes in spheroids (n = 60 from 5 independent experiments; *p < 0.05, **p < 0.005). (D) Relative mRNA expressions of stem cell markers (Nanog, Oct4, and Sox2), osteoblast markers (Runx2, Alpl, and Col1a1), and osteocyte markers (Opn, Phex, and Sost) in the spheroids at 2-day and 7-day incubation were measured by real-time PCR. All the mRNA expressions were normalized to Gapdh expressions while the results were expressed as relative amounts against the expression of monolayer sample (n = 8). The bars represent the mean ± standard error. P-value was calculated from Student’s t-test; #p < 0.05, ##p < 0.005. (E) Immunostaining images of spheroid after 2-day incubation; cell nuclei (DAPI in cyan), actin filaments (F-actin in red), and sclerostin (SOST in green). The scale bar represents 100 μm.

