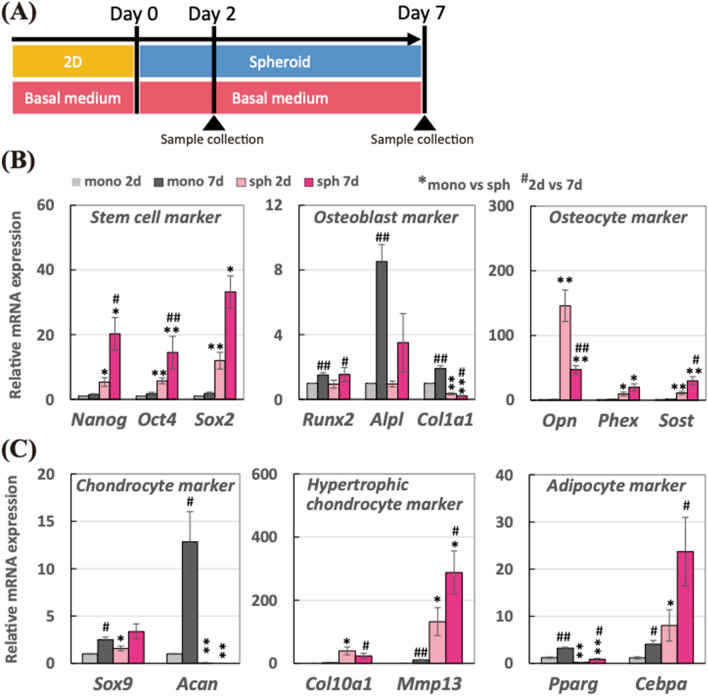
Figure 3.
(A) Schematic of the experimental time line for spheroids incubated in the basal medium in the absence of osteogenesis supplements for 7 days. Relative mRNA expressions of (B) stem cell markers (Nanog, Oct4, and Sox2), osteoblast markers (Runx2, Alpl, and Col1a1), osteocyte markers (Opn, Phex, and Sost), (C) chondrocyte markers (Sox9 and Acan), hypertrophic chondrocyte marker (Col10a1 and Mmp13), and adipocyte markers (Pparg and Cebpa) were measured by real-time PCR. All the mRNA expressions were normalized to Gapdh expressions while the results were expressed as relative amounts against the expression of monolayer sample (n = 10). The bars represent the mean ± standard error. P-value was calculated from Student’s t-test (mono vs sph: *p < 0.05, **p < 0.005; 2-day vs 7-day: #p < 0.05, ##p < 0.005).

