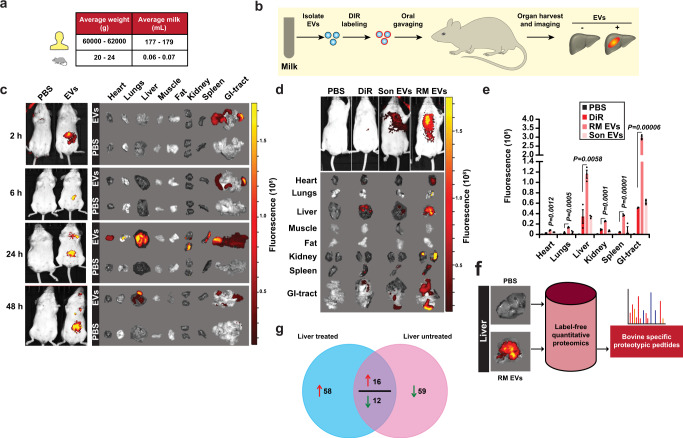
Fig. 2. Biodistribution of orally administered bovine milk-derived EVs.
a Schematic representation of dosage of milk-derived EVs and its physiologically relevant concentration in human and mice normalized to the body weight. b Schematic diagram of in vivo imaging of milk-derived EVs. c Female BALB/c mice were administered a single dose of 25 mg/kg DiR-labeled EVs by gavage (p.o.) and in vivo imaging of the mice after 2, 6, 24, and 48 h of EV administration were performed using IVIS Lumina XR-III (n = 4). d Balb/c mice were orally gavaged (p.o.) with a single dose of DiR-labeled EVs (RM EVs) (25 mg/kg), sonicated DiR-labeled EVs (Son EVs), free DiR and PBS. After 24 h, ex vivo imaging of the tissues was performed using the In vivo imaging system (IVIS). e Quantification of fluorescence in mice organs (n = 3). f Schematic representation of quantitative proteomics analysis to identify bovine proteotypic peptides in mouse liver tissues. g Venn diagram of differentially abundant proteins in mouse liver tissue of RM EVs and PBS administered mice. The red arrow represents proteins that are of high abundance in liver tissue of RM EVs treated mice compared to PBS administered mice. The green arrow represents proteins that are of lower abundance in liver tissue of RM EVs treated mice compared to PBS administered mice. All data are represented as mean ± s.e.m. Statistical significance was determined by unpaired two-tailed t-test.

