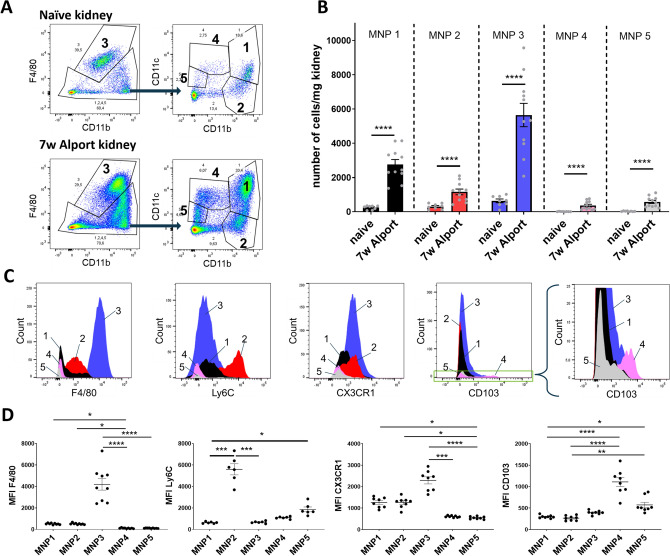
Figure 1.
Markers F4/80, CD11b, and CD11c distinguish five distinct MNP subsets in the murine kidney. (A) A gating strategy for five renal MNP subsets was adopted from Kawakami et al. and representative FACS plots are shown of a naïve mouse and 7 weeks old Col4a3−/− mice with Alport syndrome as an example for diseased state. (B) Quantification of cell numbers in the five MNP subsets for naïve (n = 8) and Col4a3−/− mice (n = 11). Shown are pooled data from two independent experiments. y = ln(y) transformed cell numbers were compared by unpaired t-test *P < 0.05, **P < 0.01, ***P < 0.001, ****P < 0.0001. (C) Representative histograms for expression of surface markers F4/80, Ly6C, CX3CR1 and C103 in all five MNP subsets. (D) Quantification of geometric mean fluorescence intensity (MFI) of surface markers. MFI were compared by Kruskal–Wallis with post-hoc Dunn’s multiple comparisons test *P < 0.05, **P < 0.01, ***P < 0.001, ****P < 0.0001.

