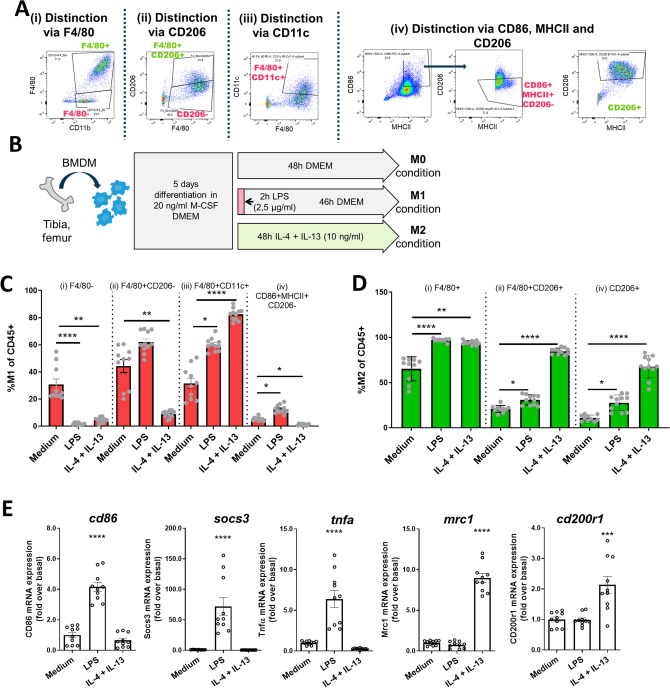
Figure 2.
CD86, MHCII, and CD206 identify M1- and M2-like cells in in vitro stimulated BMDM. (A) We applied gating strategies for M1/M2 that are commonly used in literature (i–iii) and an in-house approach (iv) to in vitro stimulated BMDM. (B) For in vitro polarization BMDM were differentiated for 5 days with M-CSF and then stimulated with LPS or IL-4 and IL-13. After 48 h cells were analyzed by flow cytometry and M1- (C) and M2-like cells (D) were quantified with each strategy from (A). (E) Duplicates were subjected to qPCR to determine expression of M1 (cd86, socs3, tnfa) and M2 (mrc1, cd200r1) genes. (n = 10 from 3 independent experiments). Kruskal–Wallis with post-hoc Dunn’s multiple comparisons test (C and D) or one way ANOVA with post-hoc Dunnett's (E) multiple comparisons test against medium *P < 0.05, **P < 0.01, ***P < 0.001, ****P < 0.0001.

