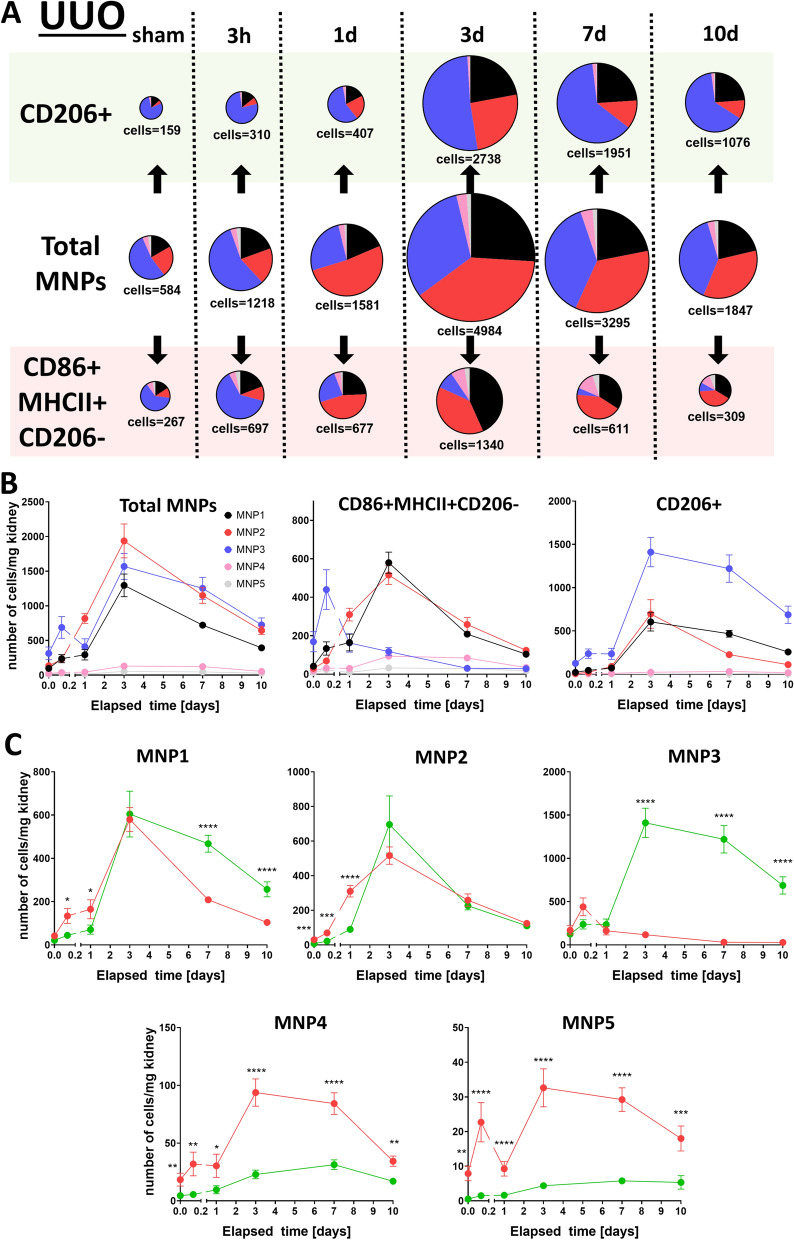
Figure 6.
CD206 + and CD86 + MHCII + CD206- cells in MNP subsets are dynamically regulated after UUO. MNP composition was monitored over a 10 day time course in a kidney injury model of UUO (n = 6 for sham, n = 10 for 3 h, n = 8 for 1d, n = 8 for 3d, n = 9 for 7d, n = 9 for 10d): Data are depicted as pie charts with their size corresponding to the amount of total cells (A, cell number is given as mean in cells per mg kidney) or plotted on a time axis grouped into CD206 + and CD86 + MHCII + CD206- cells (B) or MNP subsets (C, red = CD86 + MHCII + CD206-, green = CD206 +). Cell numbers for each time point in (C) were compared by unpaired t-test of y = ln(y) transformed data *P < 0.05, **P < 0.01, ***P < 0.001, ****P < 0.0001.

