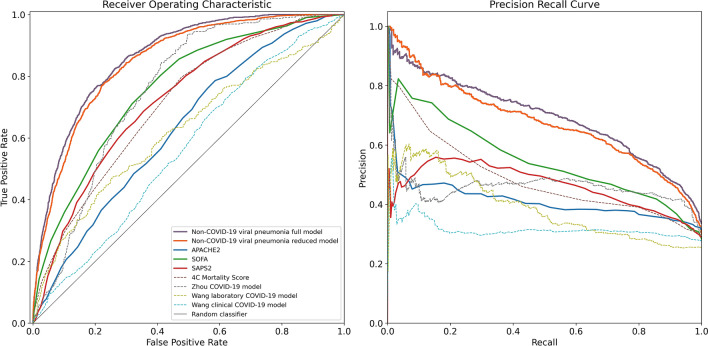
Figure 2.
Performance metrics of the non-COVID-19 viral pneumonia mortality prediction models, clinical scores and previously published COVID-19 mortality prediction models. Shown are the receiver operating characteristics (left) and precision-recall (right) curves for the full (purple) and reduced (orange) non-COVID-19 viral pneumonia mortality prediction model and for the clinical scores APACHE2 (blue), SOFA (green), SAPS2 (red) for the prediction of mortality within the next 5 days in COVID-19 patients across all 24 h time bins of each patient’s stay on the ICU, weighted inversely by the number of time bins per patient. Additionally shown are the ROC and PRC curves of previously published COVID-19 mortality prediction models (dashed lines) and the performance of a random classifier (solid gray).

