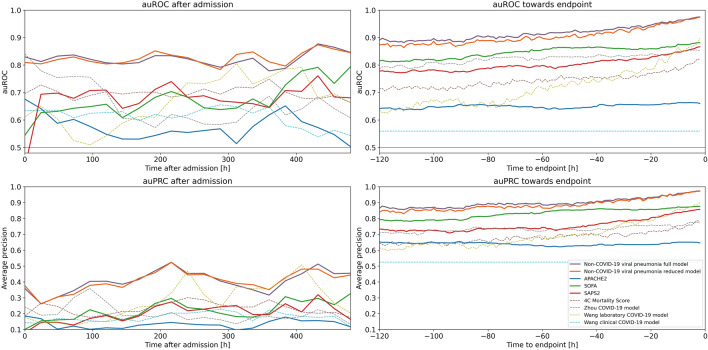
Figure 3.
Time courses of the area under the ROC curves (auROC) and area under the precision recall curve (auPRC) of the non-COVID-19 viral pneumonia mortality prediction model, clinical scores and previously published COVID-19 mortality prediction models. Shown are the auROC (top) and auPRC (bottom) time courses between admission and 20 days after admission (left) and between 120 and 1 h before the endpoint (death/control endpoint; right) for the full (purple) and reduced (orange) non-COVID-19 viral pneumonia mortality prediction models and for the clinical scores APACHE2 (blue), SOFA (green), SAPS2 (red) for the prediction of mortality within the next 5 days in COVID-19 patients. Prediction windows for the time courses after admission were 24 h and prediction windows for the time courses before the endpoints were 1 h. Additionally shown are the ROC and PRC curves of previously published COVID-19 mortality prediction models (dashed lines) and the performance of a random classifier (solid gray).

