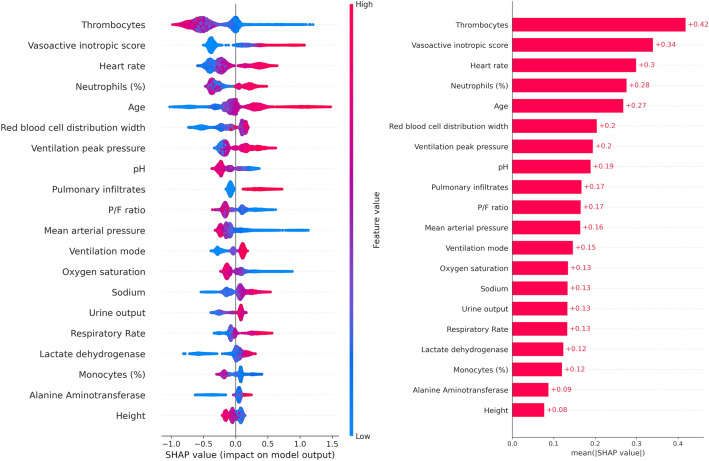
Figure 4.
Impact of clinical features on the prediction of mortality in COVID-19 patients (SHAP values). Left: Shown is the impact of feature values on the reduced models’ output for prediction of mortality of COVID-19 patients within the next 5 days. Each point represents a patient’s feature value (color-coded from blue for a low feature value to red for high feature values). Negative impact (left to the vertical line) of a feature value represents an impact towards the prediction of survival, positive impact (right to the vertical line) represents an impact towards prediction of non-survival. For example, high thrombocytes concentration levels (red) are associated with a higher probability of survival whereas low mean arterial blood pressure (blue) is associated with a lower probability of survival. Right: Mean absolute impact of each clinical feature on the model output.

