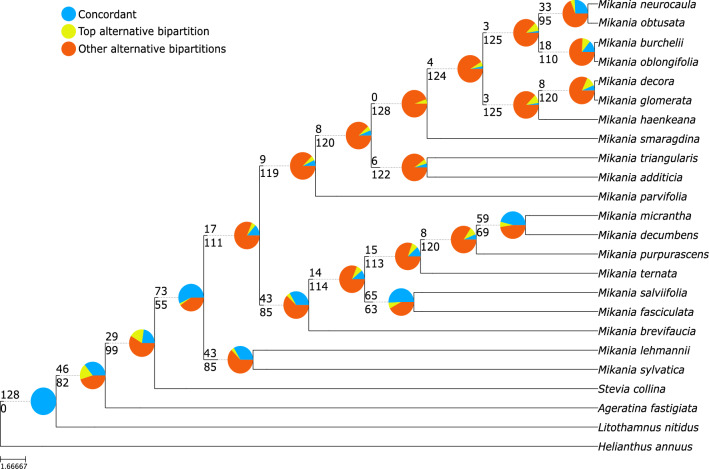
Figure 5.
Gene tree discordance analysis conducted with the total dataset and multispecies coalescent inference (Astral total). The number above the branch indicates the number of concordant gene trees and the one below the number of conflicting gene trees. Pie charts indicate the proportion of gene trees supporting that clade (blue), the proportion that supports the main alternative topology for that clade (yellow), and the proportion that supports all other topologies (orange).

