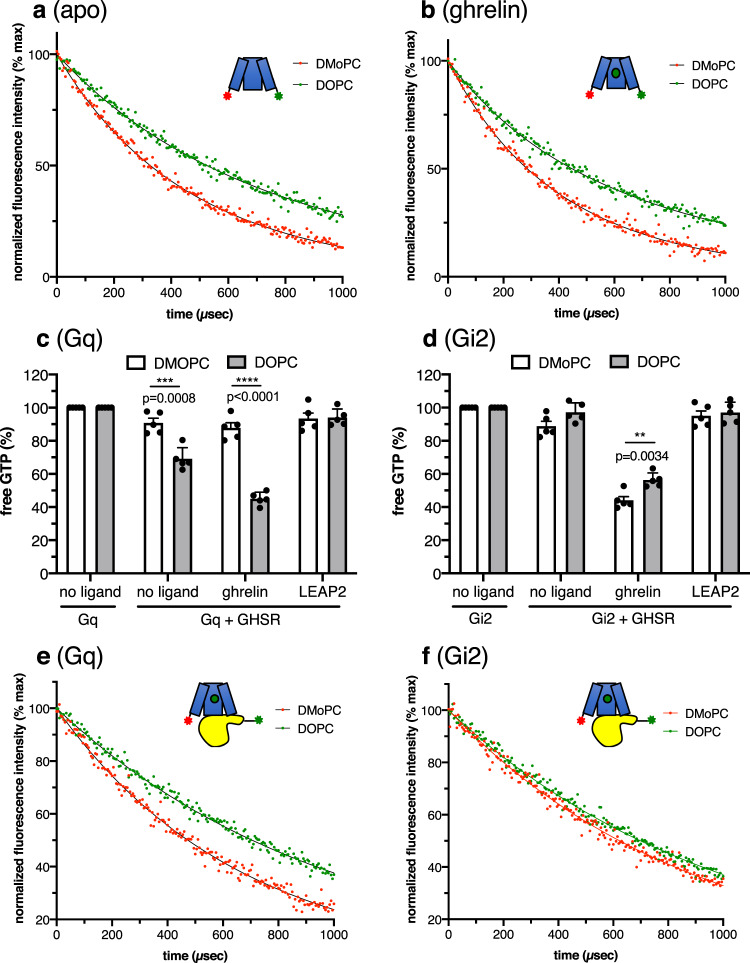
Fig. 7. Membrane thickness affects GHSR conformational state and G protein selectivity.
Sensitized-emission decays from apo (a) or ghrelin-loaded (10 µM ligand) (b) GHSR labeled with the Lumi-4 Tb donor and Alexa Fluor 488 acceptor fluorophores in TM6 and TM1 and assembled into DMoPC or DOPC nanodiscs. The profiles were recorded in the absence of G protein. GTP turnover for Gq (c) and Gi2 (d) catalyzed by GHSR in DMoPC or DOPC nanodiscs in the absence of ligand, in the presence of 10 µM ghrelin or in the presence of 10 µM LEAP2(1-14). Luminescent signal was normalized to the signal obtained for the G protein in the absence of receptor. Data in (c) and (d) are mean ± SD of five experiments. Statistical values were obtained by means of unpaired Student’s t test (**0.001 < p < 0.01, ***0.0001 < p < 0.001, ****p < 0.0001). Intermolecular sensitized-emission decays from Gαqβ1γ2 (e) or Gαi2β1γ2 (f) and ghrelin-loaded GHSR (10 µM ligand) assembled into DMoPC or DOPC nanodiscs, with the Lumi-4 Tb donor on the Gα N-terminus and the Alexa Fluor 488 acceptor on the cytoplasmic end of TM1. Data in (a), (b), (e), and (f) are presented as normalized fluorescence intensity as a function of time and represent the average of three measurements. Source data are provided as a Source data file.

