Table 1.
Lifetimes of Alexa Fluor 488 sensitized emission and corresponding molecular fractions.
| Species | τad1 (µs) | A1 (%) | τad2 (µs) | A2 (%) | |
 |
GHSR/ghrelin/POPC | 294.0 ± 7.2 | 35.3 ± 0.7 | 826.8 ± 13.8 | 64.7 ± 0.3 |
| GHSR/ghrelin/POPC + PIP2 | 289.4 ± 8.4 | 21.8 ± 0.3 | 815.7 ± 14.7 | 78.2 ± 1.1 | |
| GHSR/DMoPC | 267.2 ± 18.7 | 63.7 ± 0.8 | 557.8 ± 12.2 | 36.3 ± 0.9 | |
| GHSR/DOPC | 275.9 ± 11.5 | 64.2 ± 0.9 | 854.7 ± 17.9 | 35.8 ± 0.2 | |
| GHSR/ghrelin/DMoPC | 281.7 ± 8.2 | 39.1 ± 0.5 | 547.2 ± 14.3 | 60.9 ± 0.8 | |
| GHSR/ghrelin/DOPC | 286.3 ± 9.6 | 34.8 ± 0.2 | 834.6 ± 17.9 | 65.2 ± 0.3 | |
 |
GHSR/ghrelin/POPC/Gq | 599.3 ± 9.0 | 25.0 ± 0.8 | 1070.2 ± 9.9 | 75.0 ± 1.0 |
| GHSR/ghrelin/POPC + PIP2/Gq | 617.2 ± 13.5 | 11.7 ± 1.1 | 1062.0 ± 11.3 | 88.3 ± 1.3 | |
| GHSR/ghrelin/POPC/Gi2 | 891.7 ± 14.1 | 4.3 ± 0.3 | 1074.6 ± 18.9 | 95.7 ± 0.2 | |
| GHSR/ghrelin/POPC + PIP2/Gi2 | 881.2 ± 15.7 | 2.7 ± 0.5 | 1049.3 ± 19.3 | 97.3 ± 0.9 | |
| GHSR/ghrelin/DMoPC/Gq | 613.6 ± 16.3 | 92.5 ± 0.8 | 1074.7 ± 7.7 | 7.5 ± 0.5 | |
| GHSR/ghrelin/DOPC/Gq | 595.2 ± 14.9 | 24.8 ± 1.2 | 1069.4 ± 11.7 | 75.2 ± 1.3 | |
| GHSR/ghrelin/DMoPC/Gi2 | 918.4 ± 6.8 | 96.4 ± 1.0 | 1026.3 ± 13.3 | 3.6 ± 1.2 | |
| GHSR/ghrelin/DOPC/Gi2 | 898.1 ± 12.1 | 3.2 ± 0.9 | 1029.8 ± 8.1 | 96.8 ± 0.7 |
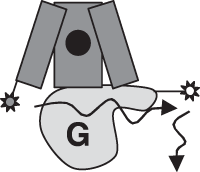
The sensitized emission τad1 and τad2 were calculated from the two dominant exponential components of sensitized emission decays. The molecular fractions A1 and A2, expressed in % of the total population, were calculated from the pre-exponential factors and the excited-state lifetime values66. The species considered are schematically presented (receptor in blue, ligand in green, G protein in yellow).
