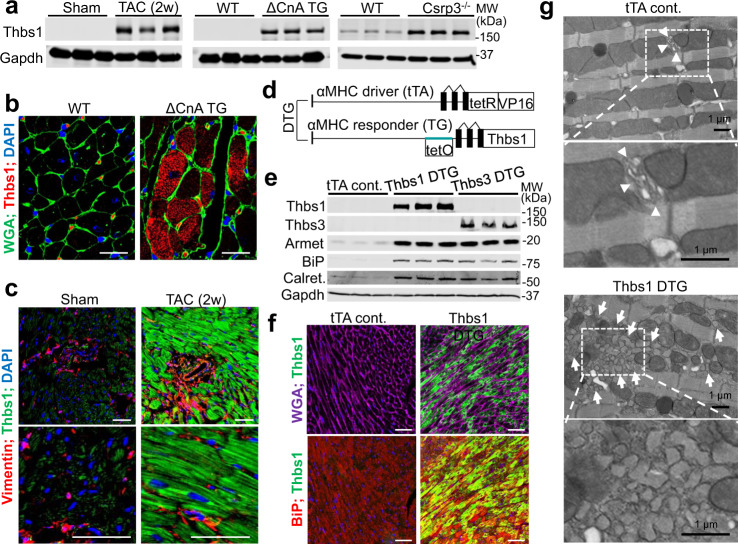
Fig. 1. Expression of Thbs1 is induced in diseased hearts where it mediates ER stress.
a Western blotting for Thbs1 in heart tissue of mice (8–10 weeks of age) subjected to 2 weeks of TAC, that contained the activated calcineurin A transgene (ΔCnA), or are Csrp3−/−, compared to sham-operated or wild-type (WT) control. Gapdh is shown as a processing and loading control. b Representative immunohistochemistry for endogenous Thbs1 (red) and cell outlines with wheat germ agglutinin (WGA)-FITC (green) with DAPI-stained nuclei (blue) from hypertrophic ΔCnA transgenic and WT control hearts at 8 weeks of age. Scale bars are 10 μm. c Immunohistochemistry for Thbs1 protein (green), vimentin (red) from sham or TAC-operated hearts, 2 weeks later. Scale bars are 50 μm. Nuclei are shown in blue with DAPI. d Schematic diagram depicting the inducible double transgenic (DTG) tetracycline-repressor system for inducible overexpression of Thbs1 in the heart. e Representative Western blots for Thbs1, Thbs3, Armet, BiP, calreticulin (calret.), and Gapdh as a loading control from hearts of tTA cont., Thbs1 DTG, and Thbs3 DTG mice at 6 weeks of age. f Representative immunohistochemistry broken into 2 channels each for overexpressed Thbs1 (green) with WGA-labeled membranes (purple), DAPI for nuclei (blue) and BiP (red) to show ER and the vesicular compartment in Thbs1 DTG hearts at 8 weeks of age. Scale bars are 50 μm. g Representative images of transmission electron microscopy of heart sections from tTA cont. and Thbs1 DTG mice at 6 weeks of age. Upper panels: arrowheads indicate ER in tTA cont., white arrows show expanded ER and vesicles only in Thbs1 DTG hearts. Lower panels: enlargement of white dotted boxed area from upper panels. Scale bars are 1 μm. Source data are provided as a Source Data File.

