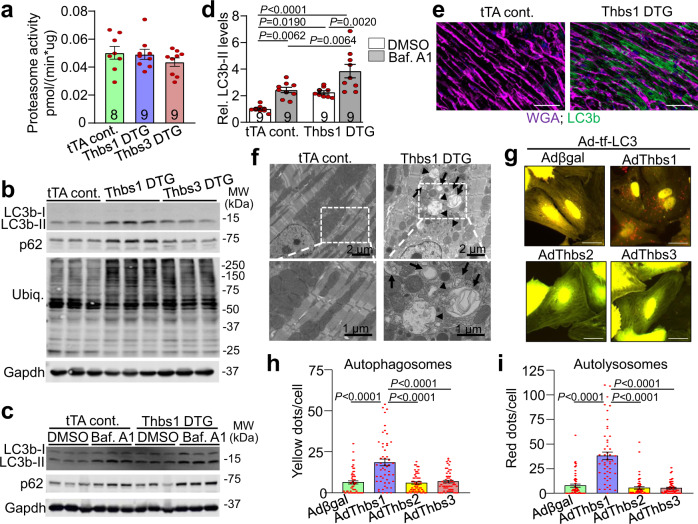
Fig. 5. Thbs1 induces autophagy and lysosomal protein degradation.
a 20S chymotrypsin-like proteasome activity measured in heart tissue of tTA cont., Thbs1 DTG, and Thbs3 DTG mice at 4 weeks of age. b Representative western blots for LC3b, p62, ubiquitin-conjugated proteins (Ubiq.), and Gapdh as loading control from hearts of tTA cont., Thbs1 DTG, and Thbs3 DTG mice at 4 weeks of age. c Representative western blots for LC3b, p62, and Gapdh as loading control from hearts of tTA cont., Thbs1 DTG treated with dimethyl sulfoxide (DMSO) as vehicle or bafilomycin A1 (Baf. A1) to inhibit autolysosome degradation at 6 weeks of age. d Quantitative analysis of LC3b-II protein levels relative to Gapdh from the experiment shown in “c”. Analysis of p62 protein levels is shown in Supplementary Fig. 3c. Data are represented as fold change compared to tTA cont. with DMSO. e Representative immunohistochemistry for LC3b protein (green) and WGA (purple) from heart sections of tTA cont. and Thbs1 DTG mice at 8 weeks of age. Scale bars are 50 μm. f Representative transmission electron microscopy of Thbs1 DTG and tTA cont. heart sections at 6 weeks of age. Autophagosomes (arrow) appear as double-membrane vesicles while autolysosomes are single membrane structures (arrowheads). Lower panels are enlargements of white dotted boxed area from upper panels. Scale bars are 2 μm and 1 μm, respectively. g–i Representative micrographs of fluorescent LC3 puncta (g) and quantification thereof (h, i) in cultured primary neonatal rat ventricular myocytes 48 h after infection with indicated adenoviruses to overexpress tandem mRFP-GFP-LC3 (Ad-tf-LC3) indicator with either Thbs1 (n = 51), Thbs2 (n = 57), Thbs3 (n = 57), or βgal control (n = 53). ‘N’ represents biologically independent cells; yellow dots represent autophagosomes, whereas free red dots indicated autolysosomes. Scale bars are 50 μm. The number of biologically independent animals analyzed for “a” and “d” is indicated on each graph. All statistical analysis were performed using one-way ANOVA and Tukey multiple comparisons test; error bars are ±standard error of the mean; P-values for panel d, h, i are shown in the graph. Source data are provided as a Source Data File.

