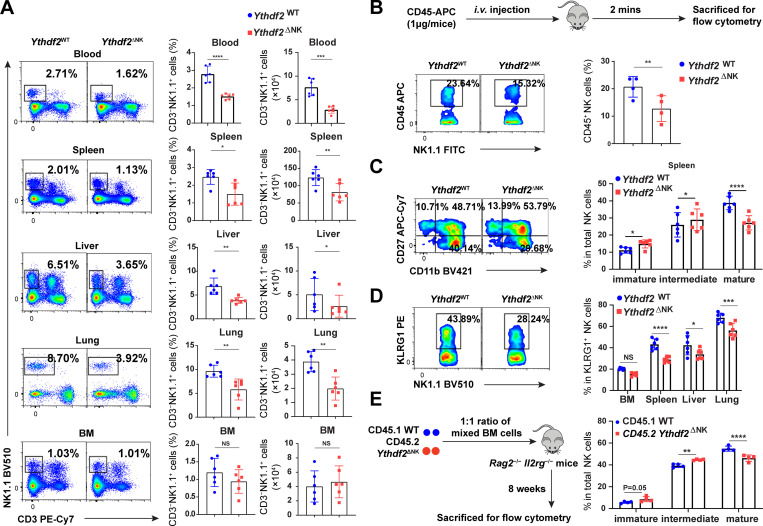
Figure 4.
Ythdf2 deficiency inhibits NK cell homeostasis and terminal maturation at a steady state.(A) Representative plots (left) and quantification (right) of the percentage and absolute number of NK cells (CD3−NK1.1+) among lymphocytes in the blood, spleen, lung, liver, and BM from Ythdf2WT and Ythdf2ΔNK mice (n = 6 per group). (B) Ythdf2WT and Ythdf2ΔNK mice were injected i.v. with an anti-CD45 antibody to mark immune cells and sacrificed after 2 min, and their BM cells were analyzed. Schematic of assays for evaluating NK cell trafficking in vivo (top). Representative plots (bottom left) and quantification (bottom right) of CD45+ NK cells in the BM from Ythdf2WT and Ythdf2ΔNK mice are shown (n = 4 per group). (C) Representative plots (left) and the quantification (right) of immature (CD11b−CD27+), intermediate mature (CD11b+CD27+), and terminal mature (CD11b+CD27−) stages of NK cells from Ythdf2WT and Ythdf2ΔNK mice are shown (n = 6 per group). (D) Representative plots (left) and quantification (right) of KLRG1+NK cells from Ythdf2WT and Ythdf2ΔNK mice are shown (n = 6 per group). (E) A mixture of 5 × 10⁶ BM cells at a 1:1 ratio from CD45.1 or Ythdf2ΔNK CD45.2 mice were cotransferred into Rag2−/−Il2rg−/− mice. Reconstitution of recipients was assessed by flow cytometry 8 wk after transplantation. A schematic diagram is shown for assays evaluating NK cell maturation in a chimeric model (left). The percentage (right) of immature (CD11b−CD27+), intermediate mature (CD11b+CD27+), and terminal mature (CD11b+CD27−) stages of NK cells from CD45.1 mice and Ythdf2ΔNK mice are shown (n = 4 per group). Data are shown as mean ± SD and were analyzed by unpaired two-tailed t test (A and B) or two-way ANOVA with Šídák post-test (C–E). Data are representative of at least three independent experiments. *, P < 0.05; **, P < 0.01; ***, P < 0.001; ****, P < 0.0001.

