Figure 7.
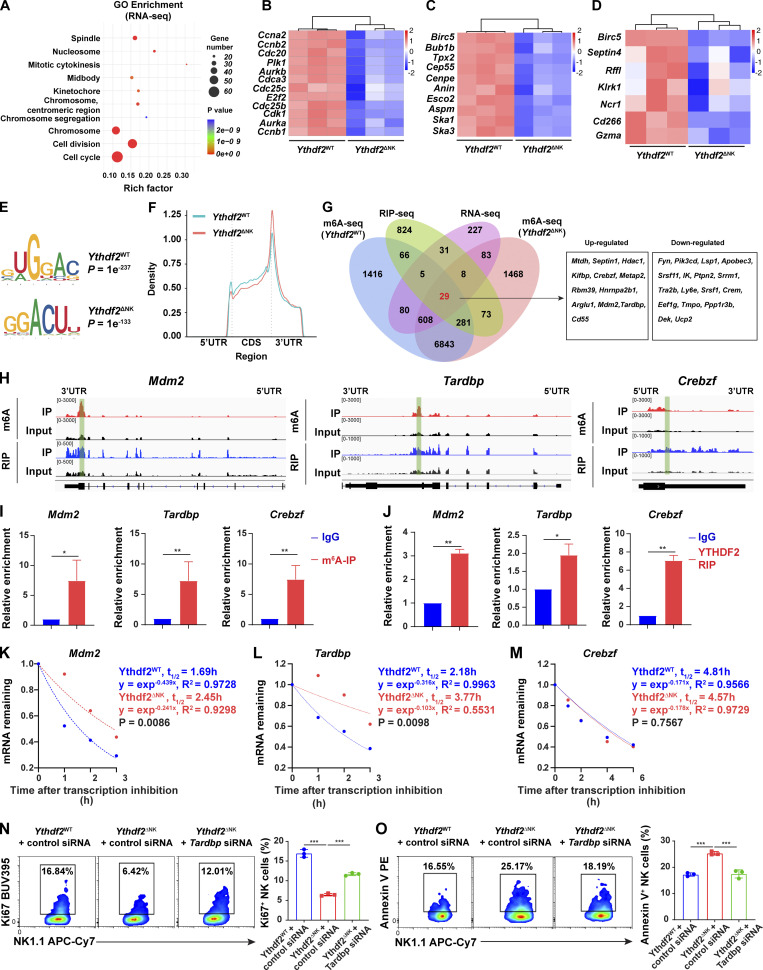
Transcriptome-wide identification of YTHDF2-binding targets in NK cells.(A) Top 10 GO clusters from GO analysis of differentially expressed genes from RNA-seq data. (B–D) Heat maps of differentially expressed genes between NK cells from Ythdf2WT and Ythdf2ΔNK mice from RNA-seq grouped by cell cycle and division (B), spindle and chromosome (C), and cell survival and NK cell function (D). (E) The m6A motif detected by the HOMER motif discovery toll with m6A-seq data. (F) Density distribution of the m6A peaks across mRNA transcriptome from m6A-seq data. (G) Overlapping analysis of genes identified by RNA-seq, m6A-seq, and RIP-seq. 12 upregulated and 17 downregulated differentially expressed transcripts bound by YTHDF2 and marked with m6A are listed on the right. (H) Distribution of m6A peaks and YTHDF2-binding peaks across the indicated transcripts by Integrative Genomics Viewer. (I and J) RIP using either an m6A (I) or a YTHDF2 antibody (J) followed by qPCR to validate the target genes identified by m6A-seq and RIP-seq. Rabbit IgG was used as control. Enrichment of indicated genes was normalized to the input level. (K–M) The mRNA half-life (t1/2) of Mdm2 (K), Tardbp (L), and Crebzf (M) transcripts in NK cells from Ythdf2WT and Ythdf2ΔNK mice. Data represent two independent experiments. (N and O) IL-2–expanded NK cells were transfected with Tardbp-specific siRNA cells under the stimulation of IL-15 (50 ng/ml). 3 d after transfection, cell proliferation or apoptosis were analyzed by Ki67 staining or annexin V staining, respectively, followed by a flow cytometric analysis (n = 3 per group, at least two independent experiments). Data are shown as mean ± SD and were analyzed by unpaired two-tailed t test (I and J) or one-way ANOVA (N and O). *, P < 0.05; **, P < 0.01; ***, P < 0.001.

