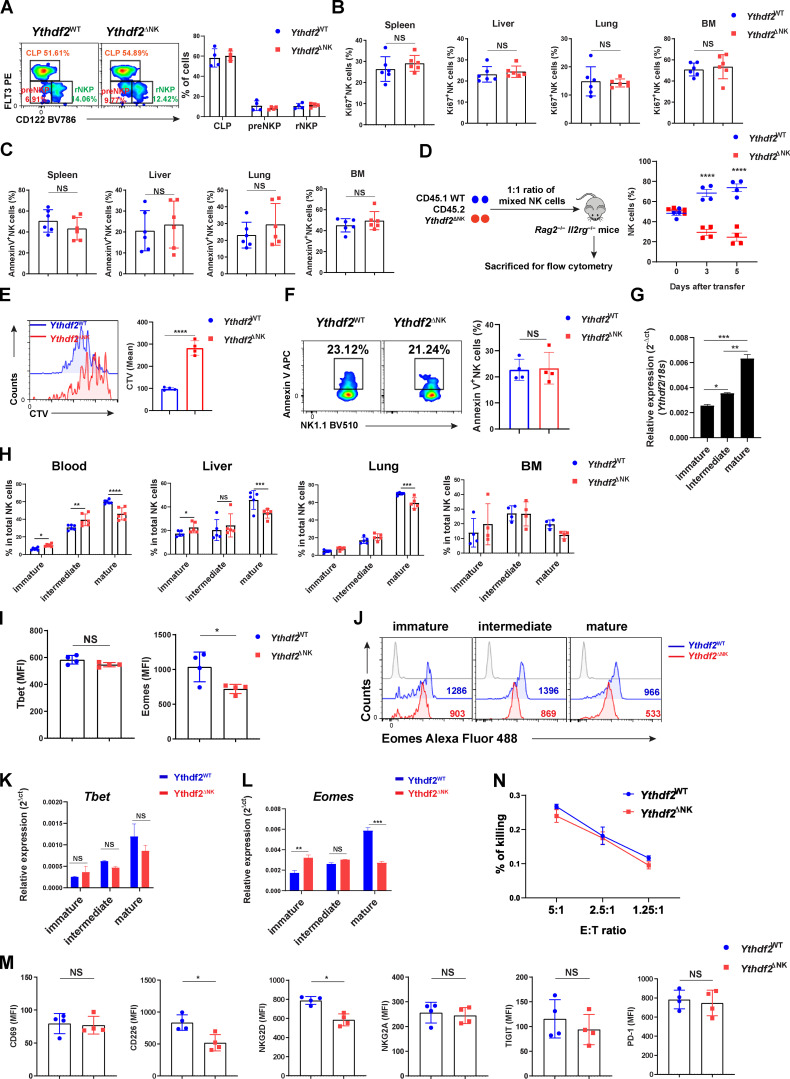
Figure S3.
YTHDF2 controls NK cell homeostasis, terminal maturation, and effector function at a steady state.(A) Representative plots (left) and quantification (right) of common lymphoid progenitor (CLP; Lin−CD27+2B4+CD127+Flt3+CD122−), pre–NK cell progenitor (preNKP; Lin−CD27+2B4+CD127+Flt3−CD122−), and refined NK cell progenitor (rNKP; Lin−CD27+2B4+CD127+Flt3−CD122+) in the BM between Ythdf2WT and Ythdf2ΔNK mice (n = 4 per group). Cells were gated on Lin−CD27+2B4+CD127+. (B) The percentage of Ki67+ NK cells in the spleen, liver, lung, and BM from Ythdf2WT and Ythdf2ΔNK mice (n = 6 per group). (C) The percentage of annexin V+ NK cells in the spleen, liver, lung, and BM from Ythdf2WT and Ythdf2ΔNK mice (n = 6 per group). (D) Scheme for evaluating NK cell homeostatic proliferation in vivo (left). Relative percentage (right) of transferred WT and Ythdf2ΔNK mice in the spleen of Rag2−/−Il2rg−/− mice at indicated time points after adoptive transfer is shown (n = 4 mice per group). (E) Representative histograms (left) and quantification (right) of CTV dilution of transferred WT and Ythdf2ΔNK mice in the spleen of Rag2−/−Il2rg−/− mice 5 d after adoptive transfer (n = 4 mice per group). (F) Representative plots (left) and quantification (right) of annexin V+ NK cells of transferred WT and Ythdf2ΔNK mice in the spleens of Rag2−/−Il2rg−/− mice 5 d after adoptive transfer (n = 4 mice per group). (G) qPCR showing the expression of Ythdf2 in splenic NK cells with different stages. (H) The percentage of immature, intermediate mature, and terminal mature stages of NK cells in the blood, liver, lung, and BM from Ythdf2WT and Ythdf2ΔNK mice (n = 6 mice per group). (I) Quantification of expression levels of Tbet (left) or Eomes (right) from splenic NK cells from Ythdf2WT and Ythdf2ΔNK mice (n = 4 mice per group). (J) Representative histograms of Eomes expression in immature, intermediate mature, and terminal mature stages of splenic NK cells from Ythdf2WT and Ythdf2ΔNK mice. (K and L) qPCR showing the expression Tbet (K) or Eomes (L) in immature, intermediate mature, and terminal mature stages of splenic NK cells from Ythdf2WT and Ythdf2ΔNK mice. (M) Quantification of the indicated molecules in splenic NK cells from Ythdf2WT and Ythdf2ΔNK mice (n = 4 mice per group). (N) Cytotoxicity of NK cells against RMA cells was evaluated by standard 51Cr release assays (n = 3 mice per group). Data are shown as mean ± SD and were analyzed by unpaired two-tailed t test (B, C, E, F, I, and M), one-way ANOVA with Šídák post-test (G), or two-way ANOVA with Šídák post-test (A, D, H, K, L, and N). Data are representative of at least two independent experiments. *, P < 0.05; **, P < 0.01; ***, P < 0.001; ****, P < 0.0001. E:T, effector:target; MFI, median fluorescence intensity.

