
Fig. 1.
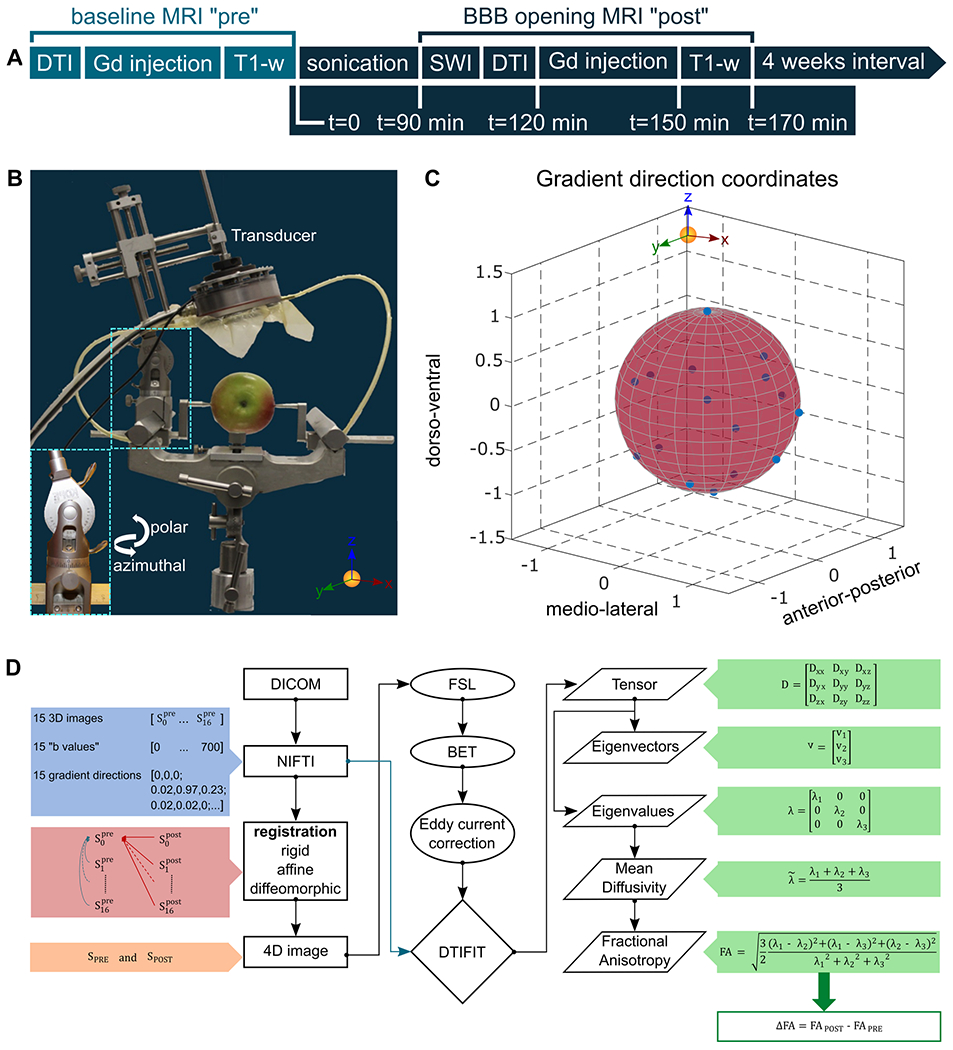
A. Timeline of the experimental procedure. The baseline scans were acquired once one month before the initiation of the sonications. SWI and DTI precede Gadolinium injection followed by T1-weighted imaging. The procedure was repeated once per month for six treatments in total, yet only four were successfully completed. B. Transducer orientation relative to the brain fixed on the stereotactic frame. C. Gradient direction coordinates are presented to confirm that diffusion sampling occurred in the entire sphere, a requirement imposed by the eddy current correction accuracy. D. Flowchart of the DTI processing pipeline. The raw data were transformed from DICOM to NIFTI format and all the directions were registered to the weight- and gradient-free image of the scan acquired before the sonications. The registered images were combined in a 4D format that was isolated from the surrounding brain tissue and corrected for eddy current artifacts. Then, the calculation of the tensor and the corresponding eigenvalues and eigenvectors resulted from the DTIFIT. The mean diffusivity and the fractional anisotropy maps were quantified by employing the appropriate equations. The difference in the FA values is reported herein, denoted as ΔFA, and resulted from the subtraction of the FA map obtained before the sonication from the FA map acquired following the sonication.