
Fig. 2.
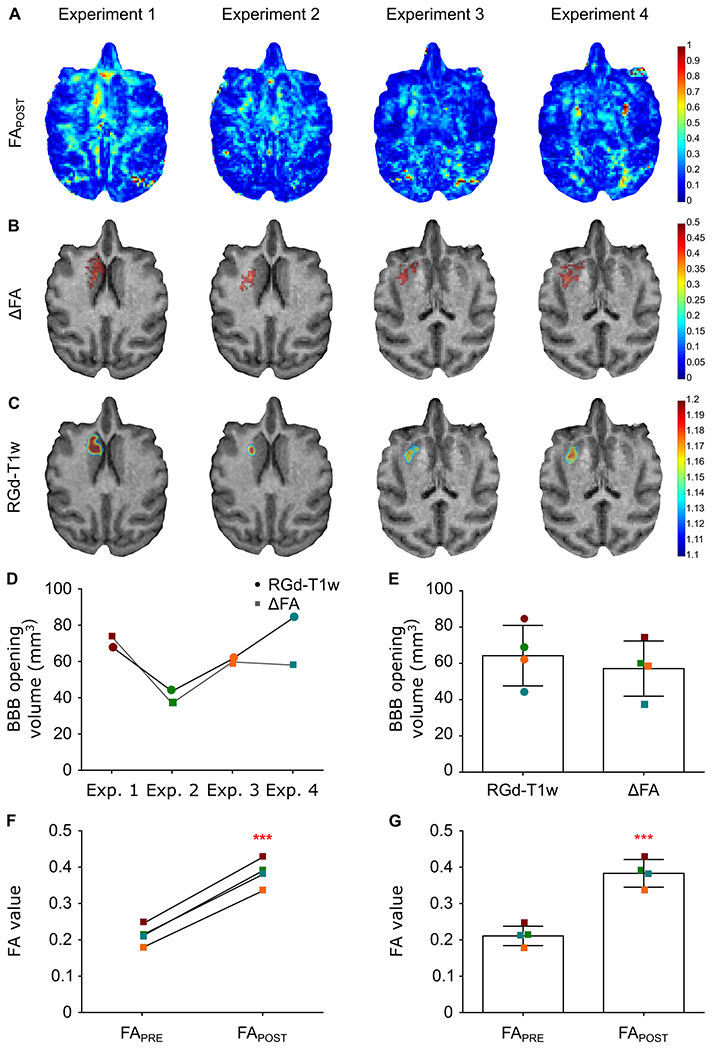
BBB opening detection with FA map, ΔFA and Gadolinium-Enhanced T1-weighted imaging for the four successfully completed experiments targeting a similar structure (Caudate nucleus region) in the same NHP. A. FAPOST maps reveal the BBB opening site despite the signal coming from other anisotropic structures. B. Normalization of the FAPOST maps (jet colormap) with the FAPRE map resulted in the pronounced BBB opening site shown in the ΔFA maps (jet colormap) overlayed on the anatomical scan (grayscale) for reference. C. The T1-weighted images’ ratio, RGd-T1, is presented herein overlayed on the same anatomical scan for comparison with the developing modality. D. Longitudinal assessment of the BBB opening volume shows comparability of the two modalities both qualitatively and quantitatively. E. Accordingly, the average BBB opening volume is similar between modalities. F,G. The FA value increased in all four cases following the sonication while increased on average by 82% from 0.21 ± 0.02 to 0.38 ± 0.03 (t[3]=27.73; P=0.0001).