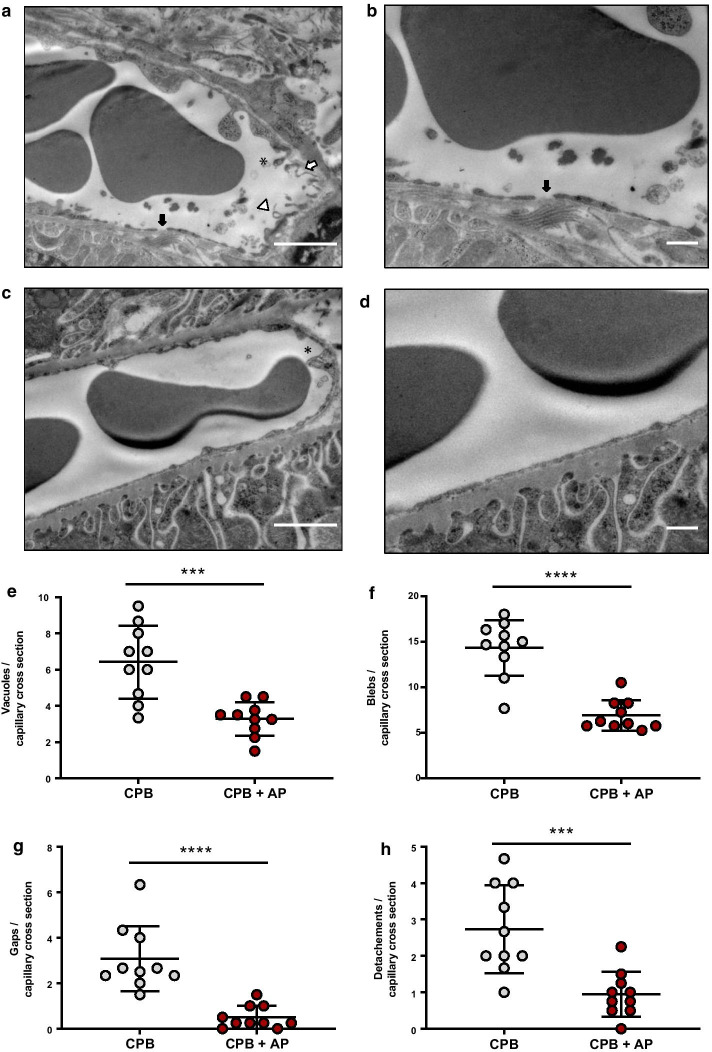
Fig. 4.
Renal endothelial structure. Electron microscopy images of kidney tissue of rats undergoing cardiopulmonary bypass (a, b, CPB, n = 3, with different magnification) and CPB with aprotinin treatment (c, d, CPB + AP, n = 4, with different magnification) and quantification of endothelial vacuolization (white triangle, e), membrane blebbling (black star, f), renal endothelial gap formation (black arrow, G) and endothelial cell detachment from basement membrane (white arrow, h). Data are presented as mean ± standard deviation, ***p < 0.0005, ****p < 0.0001 CPB vs. CPB + AP

