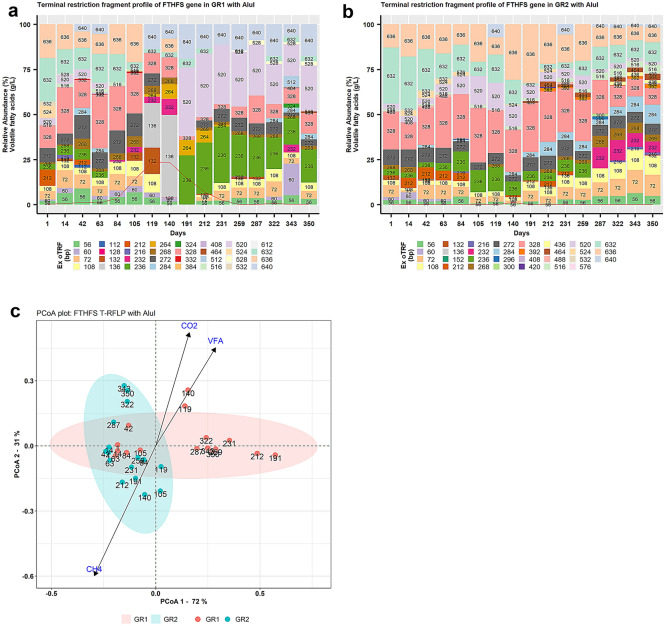
Figure 1.
Experimental terminal restriction fragment length polymorphism (T-RFLP) profile of FTHFS gene representing Ex oTRF with restriction enzyme AluI for (a) experimental reactor GR1 and (b) control reactor GR2. The red line represents the level of total volatile fatty acids (g/L) at the respective time-point. (c) Principal coordinate analysis (PCoA) plot showing microbial beta diversity reactors GR1 and GR2 using FTHFS T-RFLP profile with AluI. VFA, CH4 and CO2 are the environmental vectors which represent the level of total volatile fatty acids (g/L), methane content (%) and carbon dioxide content (%), respectively.

