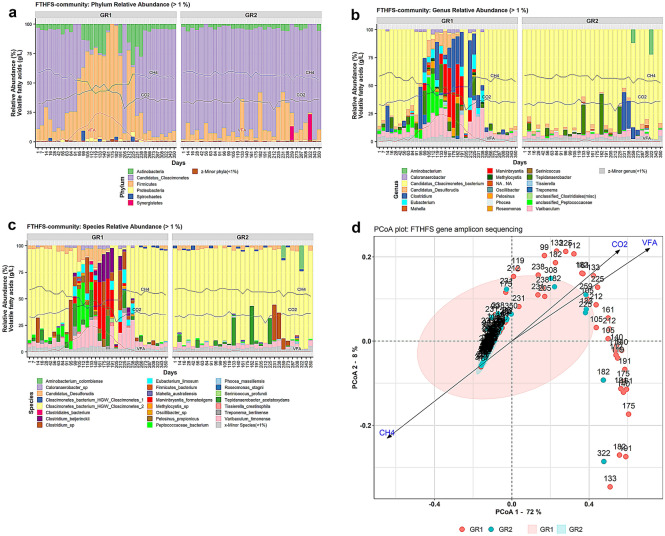
Figure 4.
Plots of acetogenic community based on FTHFS gene amplicons in experimental reactor GR1 and control reactor GR2 at (a) phylum level (relative abundance (RA) > 1%), (b) genus level (RA > 1%) and (c) species level (RA > 1%). VFA, CH4 and CO2 represent the level of total volatile fatty acids (g/L), methane content (%) and carbon dioxide content (%), respectively. (d) Principal coordinate analysis (PCoA) plot with weighted UniFrac distance matrix visualising beta diversity of the potential acetogenic community inferred from FTHFS gene sequencing in samples from reactors GR1 and GR2 under the influence of environmental parameters carbon dioxide content (%), total VFA (g/L) and methane content (%).

