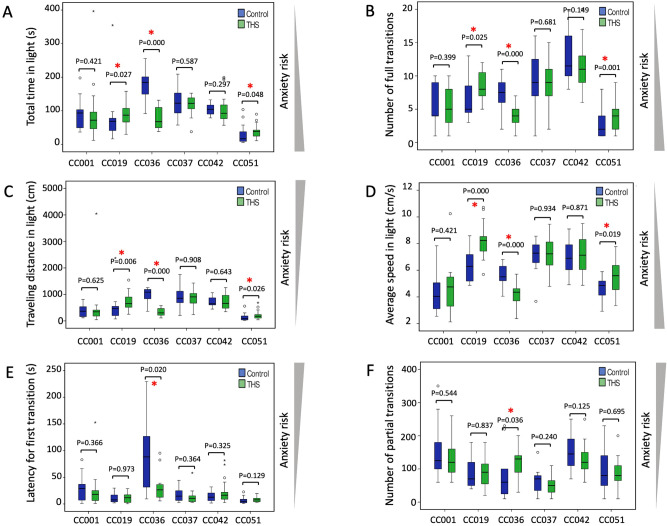
Figure 2.
THS exposure effects on anxiety-related phenotypes in six CC strains. The six phenotypes positively or negatively associated with anxiety were measured using the light–dark box. (A) Total time in light (s), (B) number of full transitions, (C) traveling distance in light (cm), (D) average speed in light (cm/s), (E) latency to first transition (s), (F) number of partial transitions. Control mice are shown in blue and THS exposed mice in green. Bars indicate the 1st and 3rd quartiles and the thick horizontal line indicates the median. Error bars indicate minimum and maximum values excluding outliers. P values were obtained by Mann–Whitney test. A red asterisk indicates a P value < 0.05. The triangle bars on the right side of the plots indicate the direction of anxiety risk. See Table 1 and Supplementary Figure S1 for more details.

