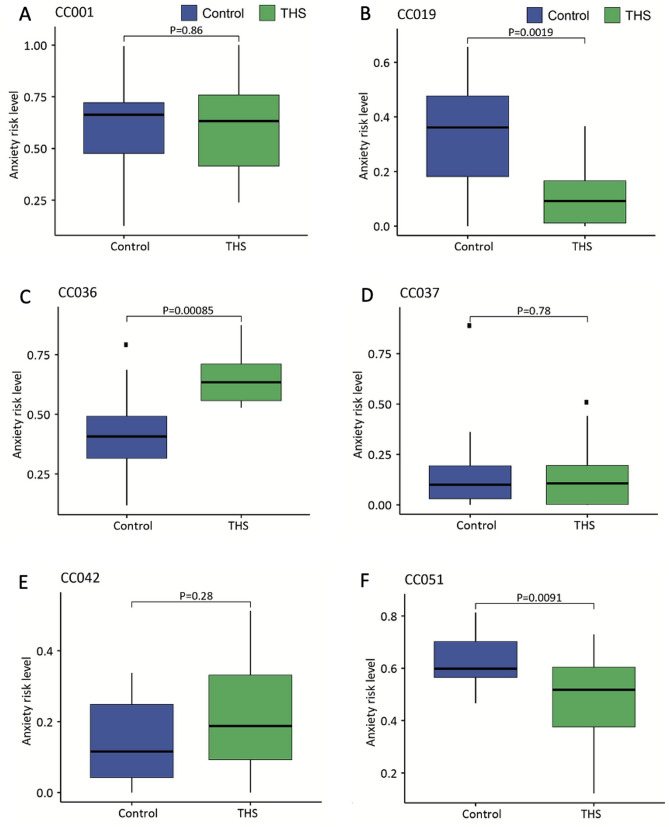
Figure 3.
Evaluation of CC mouse anxiety level using the anxiety risk score (ARS). Anxiety risk scores were calculated for control and THS exposed CC001 (A), CC019 (B), CC036 (C), CC037 (D), CC042 (E) and CC051 (F). Bars indicate the 1st and 3rd quartiles and the thick horizontal line indicates the median. Error bars indicate minimum and maximum values excluding outliers. P values were obtained by Mann–Whitney test. A red asterisk indicates a P value < 0.05.

