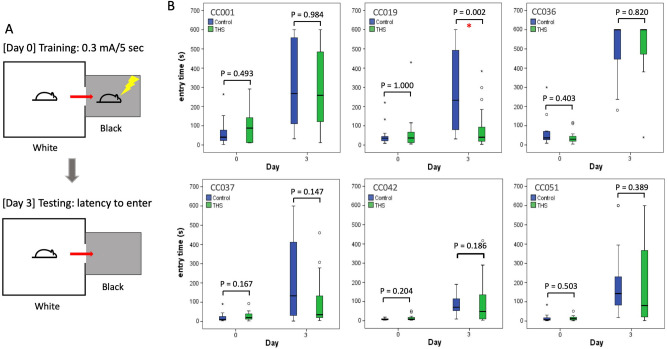
Figure 4.
Effects of THS exposure on memory across six CC strains. (A) Passive avoidance memory test showing both training and testing phases. During the training phase, the latency to enter the dark compartment is measured. A mild foot shock (0.3 mA for 5 s) is applied. During the testing phase, the latency to enter the dark compartment is measured as an indicator for memory potential. No foot shock is applied during the testing phase. (B) The entry time (s) at day 0 and day 3 is shown for all six strains (control mice shown in blue and THS exposed mice in green). Bars indicate the 1st and 3rd quartiles and the thick horizontal line indicates the median. Error bars indicate minimum and maximum values excluding outliers. P values were obtained by Mann–Whitney test. A red asterisk indicates a P value < 0.05.

