Figure 6.

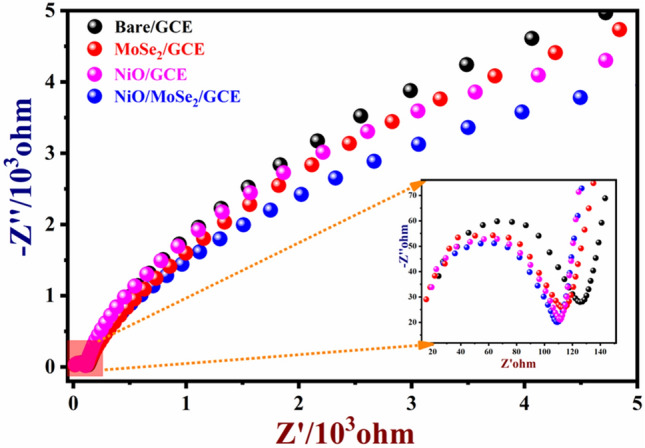
Typical Nyquist plots of NiO/MoSe2/GCE, NiO/GCE, MoSe2/GCE and bare/GCE were recorded in 0.1 M KCl containing 5 mM [Fe(CN)6]3−/4− in the frequency range from 0.1 Hz to 1000 kHz (inset is the enlarged view of high frequency range).

Typical Nyquist plots of NiO/MoSe2/GCE, NiO/GCE, MoSe2/GCE and bare/GCE were recorded in 0.1 M KCl containing 5 mM [Fe(CN)6]3−/4− in the frequency range from 0.1 Hz to 1000 kHz (inset is the enlarged view of high frequency range).