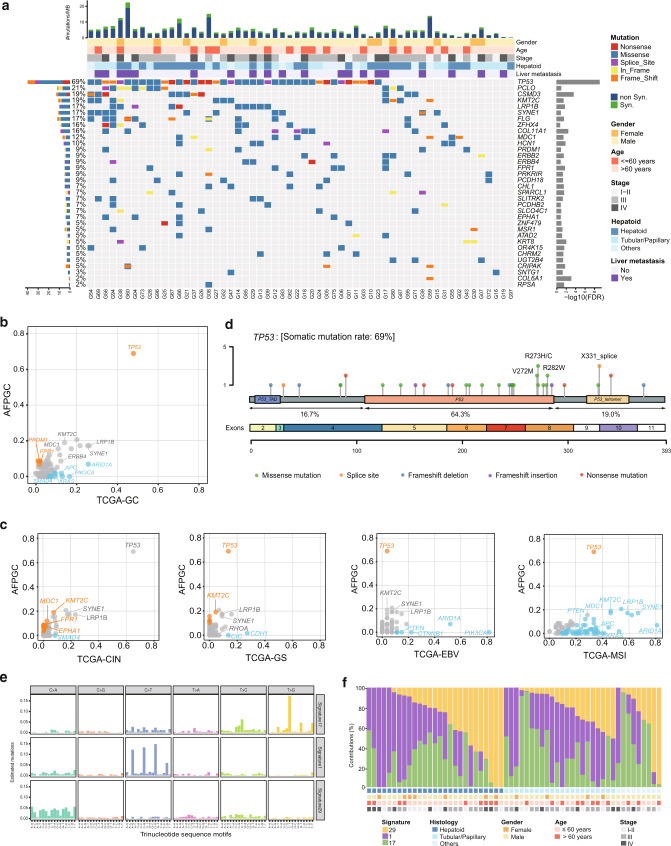
Fig. 1. The landscape of somatic mutations and mutational signatures of AFPGC.
a Somatic mutations of 58 pairs of AFPGC samples. The matrix in the middle panel shows somatic mutations by tumor sample (column) and by gene (row). The top histogram shows the frequency of nonsynonymous mutation and synonymous mutation. The top tracks show histopathological characteristics of tumor samples. The left histogram shows the number of alterations accumulated on 34 significantly mutated genes identified by MuSic analysis. The right histogram shows negative log transformation of P-value. b, c Gene mutation rates of AFPGC in comparison with TCGA-GC (b) or four subtypes of TCGA-GC (c). Orange dots, genes with significantly higher mutation rate in AFPGC; blue dots, genes with significantly lower mutation rate in AFPGC. d Distribution of nonsynonymous somatic TP53 mutations identified in 58 AFPGC. e Ninety-six substitutions derived from WES data of 58 pairs of AFPGC samples. The horizontal axis represents mutation patterns of 96 substitutions with different colors. The vertical axis depicts the estimated mutations attributed to a specific mutation type. f The distribution of mutation signatures in AFPGC across various clinicopathological characteristics. AFPGC, α-fetoprotein-producing gastric carcinoma; CIN, chromosomal instability; EBV, Epstein–Barr virus; FDR, false discovery rate; GS, genomically stable; Hepatoid, hepatoid differentiation; MSI, microsatellite instability; Non syn, nonsynonymous mutation; Syn, synonymous mutation; TCGA, The Cancer Genome Atlas; Tubular/Papillary, tubular or papillary differentiation. Source data are provided as a Source Data file.

