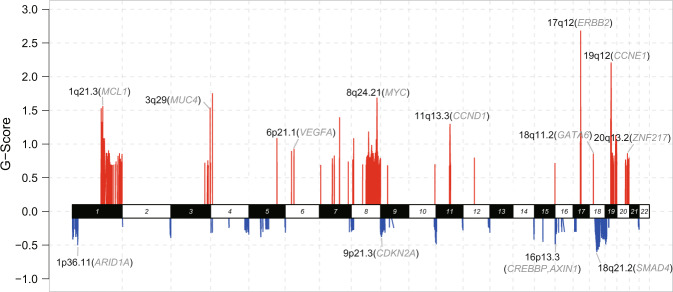
Fig. 2. The landscape of somatic copy number alterations of AFPGC.
Somatic copy number alterations identified by GISTIC 2.0 analysis. The genome is oriented horizontally and GISTIC scores at each locus are plotted from the bottom to top. Red represents focal amplification and blue represents deletion in the genomic regions. Representative amplification/deletion and corresponding genes are labeled as the SCNA region (representative gene). G-score, GISTIC scores. Source data are provided as a Source Data file.

