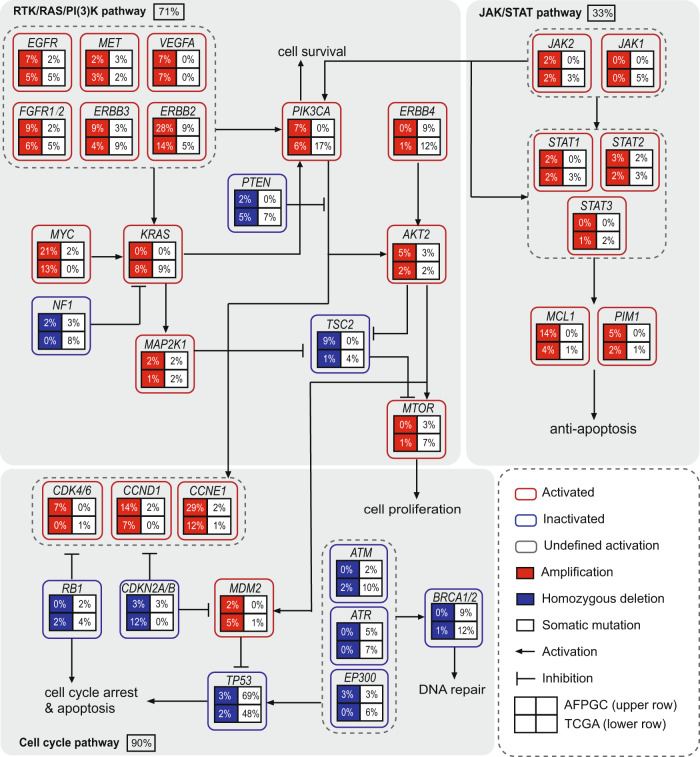
Fig. 3. Comparison of genetic alterations of signaling pathways in AFPGC and TCGA-GC.
Somatic mutations and SCNAs in key signaling pathways are shown for AFPGC (n = 58) and TCGA-GC (n = 393) cohort. Three major signaling pathways, namely RTK/RAS/PI(3)K pathway, cell cycle pathway, and JAK/STAT pathway, were shown. In a square grid, the upper row represents AFPGC and the lower row represents TCGA-GC. Percentages represent the alteration frequencies. SCNAs, somatic copy number alterations. Source data are provided as a Source Data file.

