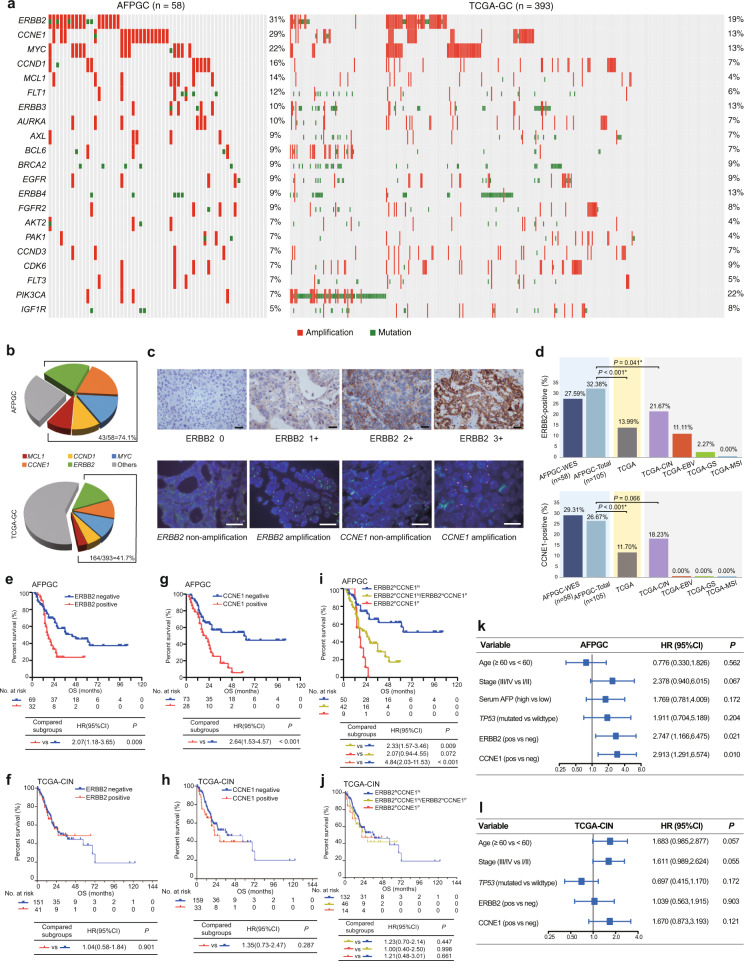
Fig. 4. Potentially targetable alterations in AFPGC and TCGA-GC, and survival analysis.
a Genomic alterations of potentially targetable genes in AFPGC and TCGA-GC. b Overall frequency of selected targetable genes in AFPGC and TCGA-GC. c Representative images of ERBB2 and CCNE1 status. Presented data are a representative image of three independent experiments. Upper panel shows IHC score of ERBB2 with 0, 1+, 2+, and 3+. Lower panel shows representative FISH image of ERBB2 and CCNE1. Scale bar represents 50 μm. d The positive rate of ERBB2 and CCNE1 in AFPGC and TCGA-GC. e, f Associations between ERBB2 status and OS in AFPGC (e) or in TCGA-CIN (f). g, h Associations between CCNE1 status and OS in AFPGC (g) or in TCGA-CIN (h). i, j Associations between combined status of ERBB2 and CCNE1 and OS in AFPGC (i) or in TCGA-CIN (j). k, l Forest plot of multivariable Cox proportional hazard regression in AFPGC (k) or in TCGA-CIN (l). The hazard ratios are presented and the horizontal lines indicate the 95% confidence intervals. In AFPGC-WES and TCGA-GC, the positive status of ERBB2/CCNE1 was defined as amplification by GISTIC 2.0. In AFPGC-total, the definition of the positive status of ERBB2 and CCNE1 was shown in Supplementary Methods. Statistical significance was determined using two-sided χ2-test (d), log-rank (Mantel–Cox) test (e–j), and multivariate Cox regression (k, l). AFPGC-WES, the AFPGC cohort with WES data; AFPGC-total, the whole AFPGC cohort in this study; CCNE1N, CCNE1 negative; CCNE1P, CCNE1 positive; CI, confidence interval; ERBB2N, ERBB2 negative; ERBB2P, ERBB2 positive; FISH, fluorescence in situ hybridization; HR, hazard ratio; IHC, immunohistochemistry; neg, negative; OS, overall survival; pos, positive. Source data are provided as a Source Data file.

