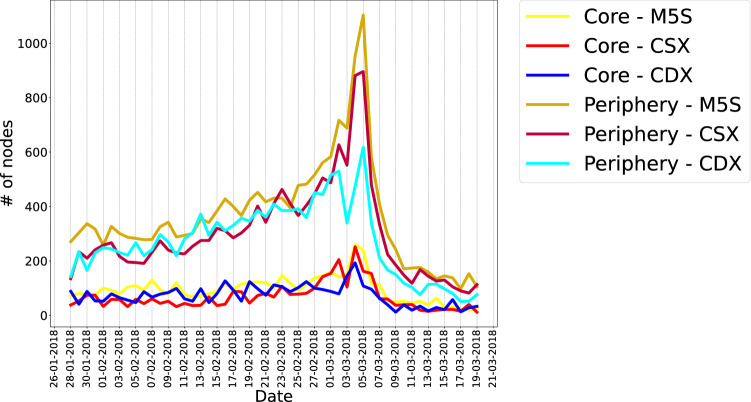
Figure 8.
Evolution of the number of nodes belonging to the core and to the periphery of each discursive community. The core size is nearly constant throughout the observation period while the periphery size rises as the Election Day approaches (the peak appears in correspondence of the day after, i.e. the 5 March 2018). This behavior, common to all communities, reveals that, as the Election Day approaches, the number of topics animating the discussion increases.

