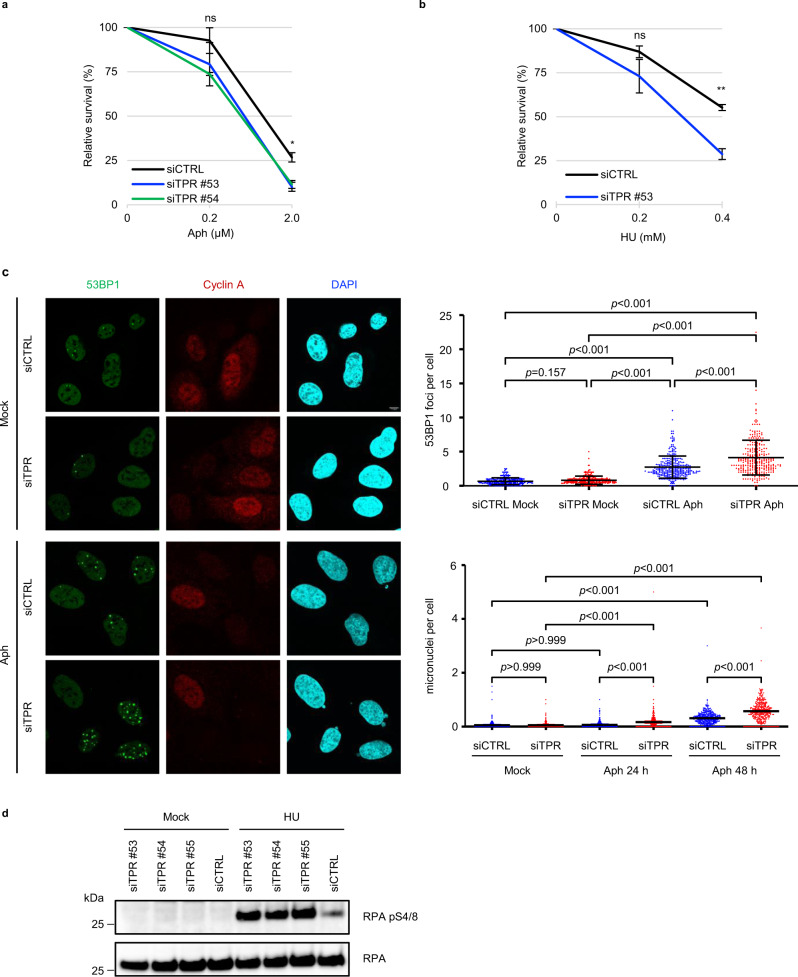
Fig. 1. Tpr depletion sensitizes cells to replication stress.
a Clonogenic survival of Tpr-depleted (siTPR) and control U-2 OS cells (siCTRL) treated with aphidicolin (Aph). Data are represented as mean ± SEM from three independent experiments (n = 3). Statistical analysis: Brown–Forsythe and Welch ANOVA with Dunnett’s T3 post analysis for multiple comparisons; ns not significant; *p value < 0.05. b Clonogenic survival of Tpr-depleted (siTPR) and control U-2 OS cells (siCTRL) treated with hydroxyurea (HU). Data are represented as mean ± SEM from three independent experiments (n = 3). Statistical analysis: Mann–Whitney test and Welch’s t-test; ns not significant; **p value < 0.01. c Representative images of 53BP1 foci in Tpr-depleted (siTPR) and control (siCTRL) U-2 OS cells. Cells were either nontreated (Mock) or treated with 0.2 μM aphidicolin for 48 h (Aph). The staining of cyclin A serves as a marker of the cell cycle stage. Nuclei were stained with DAPI. The scale bar, 7.5 µm. Top right: quantification of 53BP1 foci in Tpr-depleted (siTPR) and control U-2 OS cells (siCTRL) either nontreated (Mock) or exposed to 0.2 μM aphidicolin for 48 h (Aph). A series of nonoverlapping frames were randomly acquired by automated microscopy, and the 53BP1 foci in G1 nuclei (cyclin A negative) were counted. Data are represented as mean ± SD from three independent experiments (n = 3). Statistical analysis: Kruskal–Wallis test with Dunnett’s T3 post analysis for multiple comparisons. Bottom right: quantification of micronuclei in Tpr-depleted (siTPR) and control U-2 OS cells (siCTRL) performed on the same samples as 53BP1 foci analysis (top right panel). Data are represented as mean ± SEM from three independent experiments (n = 3). Statistical analysis: Kruskal–Wallis test with Dunnett’s T3 post analysis for multiple comparisons. d Depletion of Tpr leads to increased RPA pS4/8 phosphorylation upon hydroxyurea treatment. Cells were transfected with three independent siRNAs targeting Tpr (siTPR #53, siTPR #54, siTPR #55) or control siRNA (siCTRL). Transfected cells were either nontreated (Mock) or treated with 2 mM hydroxyurea (HU) for 4 h. Staining of RPA total is used as a loading control. Data are representative of three independent experiments. Source data for d are provided in the Source Data file.

