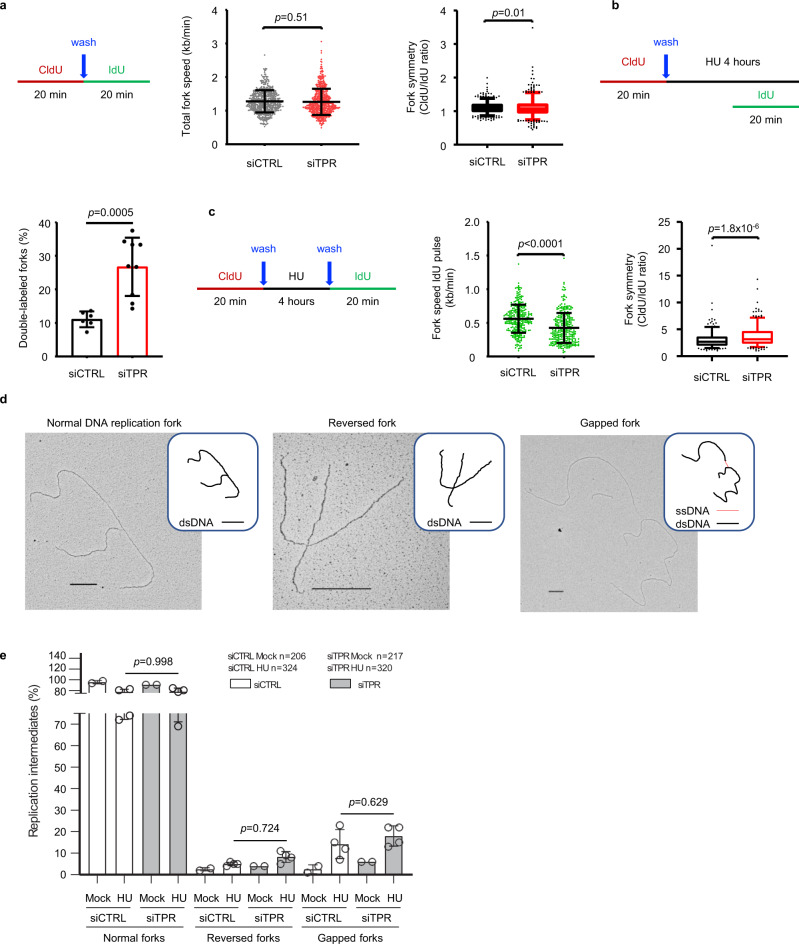
Fig. 2. Tpr depletion impacts replication fork progression.
a DNA fiber analysis of the replication fork speed and symmetry in nontreated conditions. Left: schematic of the CldU/IdU pulse-labeling protocol used. Middle: analysis of the replication fork speed. Total number of molecules analyzed: siCTRL (n = 541), siTPR (n = 567). The plot includes the mean ± SD. Statistical test: unpaired t-test with Welch’s correction, two-tailed. Right: analysis of the replication fork symmetry. The ratio between CldU/IdU was calculated from values in a (left). Whiskers indicate the 5th–95th percentiles (p value associated with Kolmogorov–Smirnov test). b DNA fiber analysis of the ability of forks to stop progression in the presence of replication stress. Top: schematic of the CldU/IdU pulse-labeling protocol used. Bottom: percentage of the double-labeled replication forks containing both CldU and IdU signal is showed. Total number of slides analyzed from three independent experiments: siCTRL (n = 6), siTPR (n = 9). The plot includes the mean ± SD. Statistical test: unpaired t-test with Welch’s correction, two-tailed. c DNA fiber analysis of the replication fork recovery upon HU removal. Left: schematic of the CldU/IdU pulse-labeling protocol used. Middle: length of the IdU tracks measured upon hydroxyurea removal. Total number of molecules analyzed: siCTRL (n = 297), siTPR (n = 310). The plot includes the mean ± SD. Statistical test: unpaired t-test with Welch’s correction, two-tailed. Right: analysis of the replication fork symmetry. The ratio between CldU/IdU was calculated from values in c (middle). Whiskers indicate the 5th–95th percentiles. Statistical test: unpaired t-test with Welch’s correction, two-tailed. d Categories of DNA replication intermediates identified in TEM analysis with a schematic representation of the molecule with dsDNA in black and ssDNA in red. Scale bars of 360 nm, which correspond to 1 kb of DNA, are reported on each picture. e Chart reporting the percentages of RIs identified. Gapped forks are defined as forks with ssDNA gaps at fork junction points longer than 200 nts. Data are represented as mean ± SD from four independent experiments (n = 4) for hydroxyurea-treated (HU) samples and two independent experiments (n = 2) for nontreated samples. Statistical analysis: two-way ordinary ANOVA followed by Sidak’s multiple comparison test.

